
For correct and profitable trading in binary options, it is necessary to apply approaches such as money management and risk management. Successful forecasting and accurate trade execution also require a suitable form of analysis — one of the most widely used being technical analysis of binary options.
Technical analysis of binary options covers many types and methods, but its core purpose always comes down to identifying entry points for a trade — and, in the case of Forex market trading, exit points as well.

Basics of Technical Analysis of Binary Options
For novice traders, technical analysis is an essential tool for producing accurate forecasts of upcoming price movements, based on historical price patterns. In simple terms, technical analysis of binary options is always conducted on a chart using past price data, since price history tends to repeat itself.
Technical analysis for binary options is built on three core axioms (though these are not the only ones):
- Price discounts everything. Every event capable of moving quotes is immediately reflected on the price chart — whether it is a major economic news release, a political event, or a global crisis. Once you master technical analysis, you can trade effectively without relying on fundamental analysis.
- Price moves in trends. A trend that forms over a given period will, in most cases, remain the dominant force going forward. For example, if an uptrend is established on the daily timeframe, even deep counter-trend pullbacks are unlikely to change the overall direction. This is particularly visible on shorter timeframes such as the hourly chart, where an intraday decline does not necessarily mean the broader trend has reversed. Trends can be either upward or downward. Later in this article, we will explain how to identify the trend and open trades in the right direction.
- History repeats itself. Market dynamics are largely driven by human psychology and consistent reactions to similar situations. This explains why the same chart patterns keep forming year after year. If a pattern has worked in the past, there is reason to expect it will work again, because human psychology does not change.
To conduct high-quality technical analysis for binary options trading, a trader needs to understand:
- which chart types are best suited for technical analysis;
- how trends work;
- what volatility is.
We will cover each of these topics in detail below.
Types of Charts
Technical analysis can be applied to any market — stocks, futures, cryptocurrencies — but it delivers the greatest value when forecasting prices on currency pairs. Any of the following chart types can be used for analysis:
- Line chart. Recommended for short periods (a few minutes), as it only displays the closing price of each time period.
- Bar chart. Used for five-minute periods and above. Each bar shows the high, low, open, and close prices.
- Japanese candlesticks. A chart type in which the candle body represents the range between the open and close prices, while the wicks show the high and low reached during that period.
- Bars. A chart type structured similarly to candlesticks but with a different visual appearance.
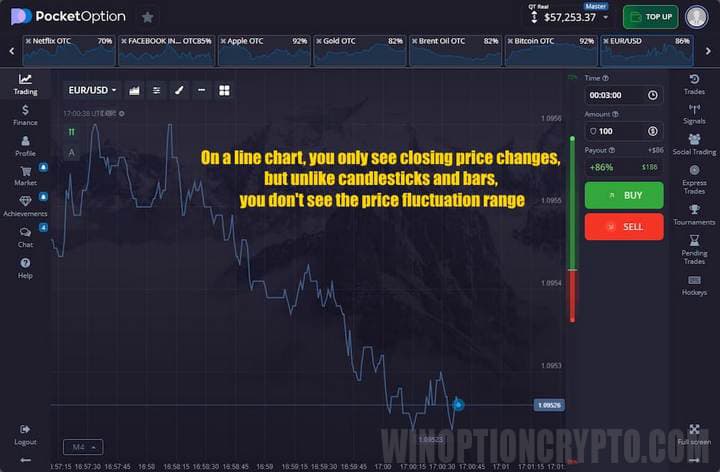
A line chart is one of the simplest chart types, connecting closing price values with a continuous line. It is plotted based on price level points — for example, on the daily timeframe (D1), the line follows the closing price of each trading day. This chart type does not display volatility and does not show how far the price moved up or down within a given session:
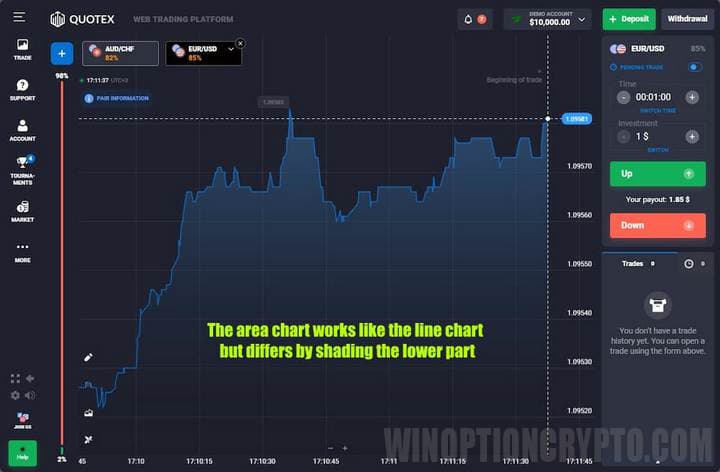
An area chart is built on the same principle as a line chart, but with the area below (or above) the line shaded, giving the chart a mountain-like appearance:
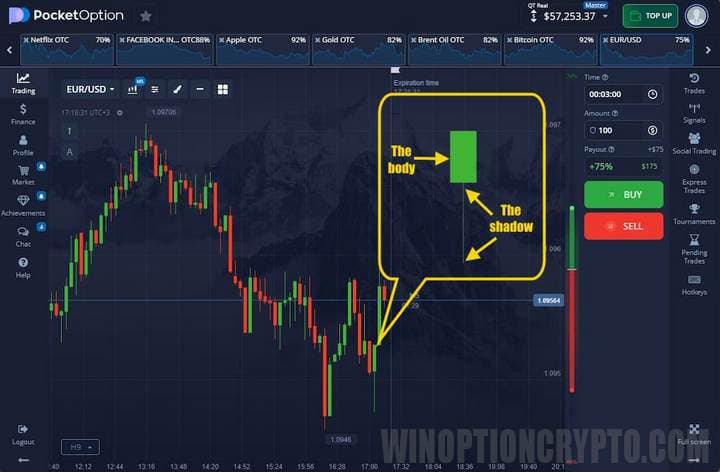
The most widely used chart type for technical analysis of binary options is the candlestick chart, as it presents price data in the most informative and visually clear format. Japanese candlesticks provide far more detail about market conditions than a simple line. Each candle displays four key data points:
- opening price;
- closing price;
- high price;
- low price.
All of this information is visible through the candle's "body" and "wicks." The body shows the open and close prices, and the candle's color indicates whether the price closed higher or lower than it opened. The wicks show the session's highest and lowest price levels. Together, these elements give a complete picture of price movement:
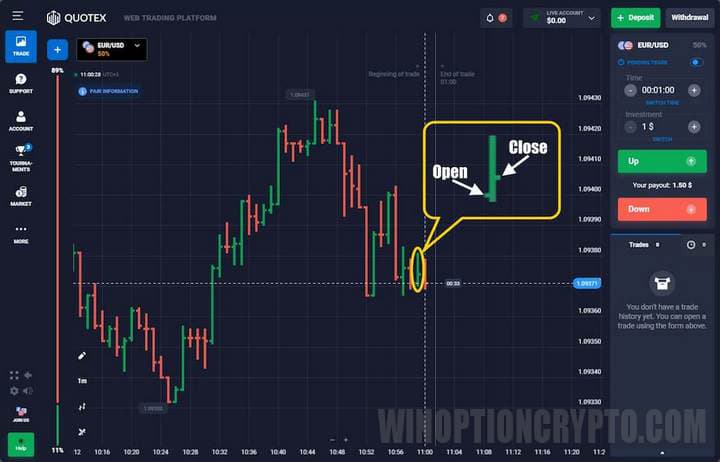
Bars display the same four data points as candlesticks but look different visually. The open and close are shown by short horizontal lines on the left and right sides of the bar, rather than by a body:
Types of Trend
The ability to identify a trend is a critical trading skill. Most strategies and indicators are built around trend-following, so without a clear understanding of trends, it is very difficult to trade binary options profitably.
A trend is a sustained, directional price movement. It can be either strong or weak:
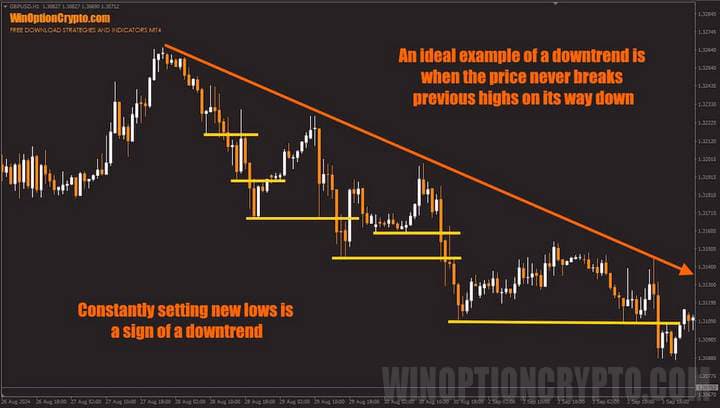
Trends are also classified by duration:
- Short-term trend. Lasts up to 2 weeks.
- Medium-term trend. Lasts from 2 weeks to 6 months.
- Long-term trend. Lasts from 6 months to several years.
Note: the same classification applies to trade types and trade durations.
Before entering any trade, technical analysis should help you determine the current price direction. In an uptrend, each successive high and low is higher than the previous one; in a downtrend, both highs and lows progressively decline.
Technical analysis of binary options also accounts for flat (sideways) market conditions, since — statistically — markets spend the majority of their time moving sideways. A flat is characterized by the absence of a clear directional movement, with price oscillating within a horizontal range.
To develop a complete understanding of trend analysis, it is also worth learning what bullish and bearish trends are, as well as the phases a trend moves through.
Volatility
Volatility refers to the degree of price fluctuation in the market. It can be high or low depending on how far the asset price deviates from its average level.
Volatility must be taken into account when conducting technical analysis and making trading decisions. The more volatile an asset, the harder it is to predict its movement. That said, high volatility can also create sharp price impulses that offer significant profit opportunities. Highly volatile assets are best suited for turbo options with expirations ranging from 60 seconds to 5 minutes, before quotes have time to revert to average values.
As an example, consider the daily volatility of the EUR/USD pair for the period from April 2020 to March 2021:
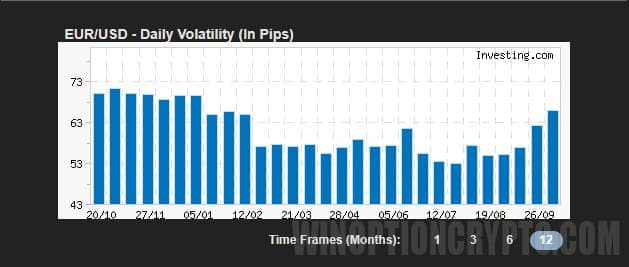
As the chart shows, the asset's volatility declined over the course of the year. The same analysis can be applied to hourly volatility, which is more relevant for trading with short expirations.
Technical Analysis of Binary Options Using Indicators
Indicators are algorithms built on mathematical formulas that track price movement and help determine its direction and momentum, identifying potential entry points.
Indicators make technical analysis more accessible for beginners. That said, experienced traders do not rely on indicators alone — they use them as supplementary tools within a broader analytical framework.
Binary options indicators are widely used for a number of reasons:
- they are easy to understand and apply;
- there are indicators suitable for any market and any timeframe;
- all indicators plot automatically, simplifying the analysis process.
Indicators are also popular because nearly all binary options trading strategies are built around them.
Indicators fall into several categories:
- signal;
- trend;
- oscillators.
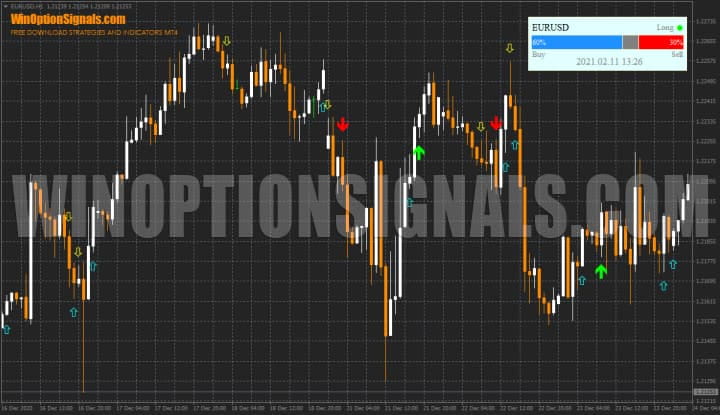
The most popular category for binary options is signal indicators, as they identify the precise moment to buy a Call or Put option. Signal indicators most commonly appear as arrows, though dots or other icons are also used. One example is the Trade Confirmed Indicator, which provides signals alongside an information panel:
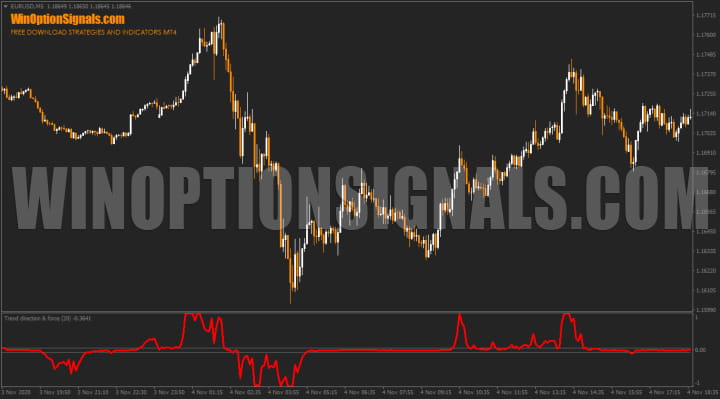
The second most popular category is trend indicators. These signal the beginning or end of a trend and can also generate option-buying signals. Their primary function is to identify market direction. They can be plotted directly on the price chart or in a separate window below it. One example is the Trend Direction Force Index, whose readings shift with market movement while remaining near zero during flat conditions:
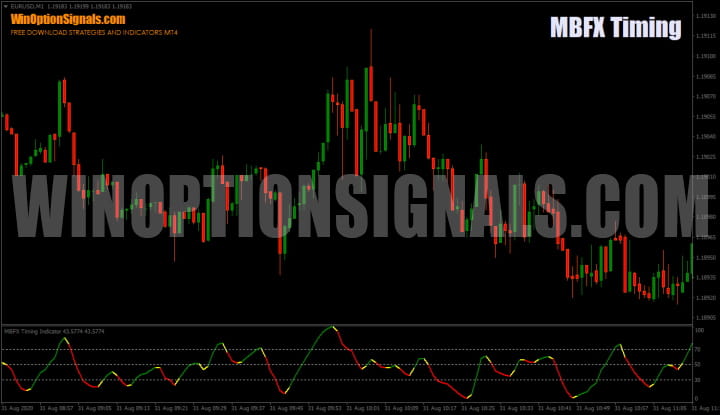
Oscillators are considered leading indicators that respond quickly to momentum shifts and display overbought/oversold levels. They are typically placed in a separate window below the price chart and move within a fixed range. Oscillators perform best during sideways price movement; during a trend, they tend to generate a higher number of false signals — something to keep in mind when analyzing binary options. A good example is the MBFX Timing indicator, which highlights potential reversals at overbought and oversold extremes:
Below, we will look at the most widely used indicators in binary options technical analysis — both for beginners and experienced traders — on which many trading strategies are based. These include:
- Moving Average;
- Ichimoku Kinko Hyo;
- Parabolic SAR;
- RSI;
- Stochastic Oscillator;
- CCI;
- MACD;
- Bollinger Bands.
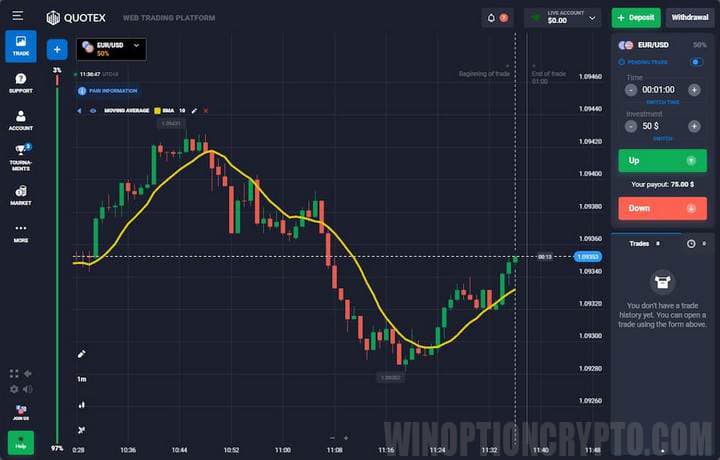
Moving Average. Moving Averages are a standard indicator on any binary options trading platform and in the MetaTrader 4 terminal. They come in simple, weighted, and exponential forms, and have served as the foundation for many more advanced tools. A Moving Average calculates the average price over a specified time period:
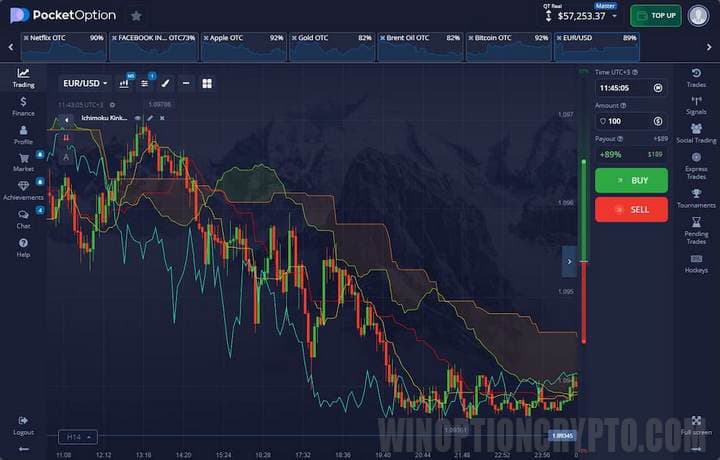
Ichimoku Kinko Hyo. This indicator combines a base line, a conversion line, and a cloud known as the Ichimoku cloud. Its algorithm identifies the optimal moment to enter a position, while also showing the trend direction, price momentum, and support/resistance levels:
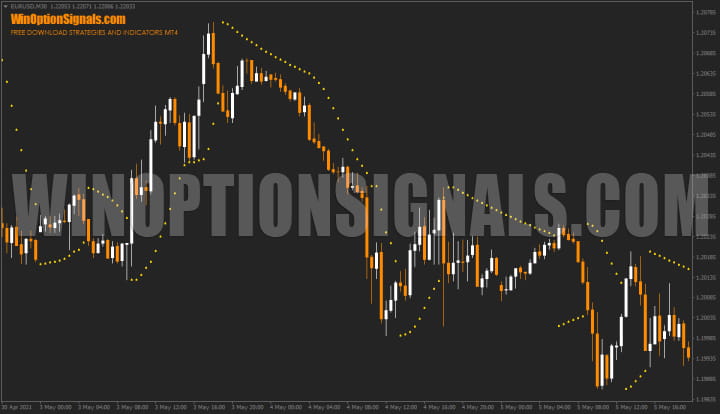
Parabolic SAR. This indicator helps identify when a trend is approaching its end. It appears as a series of dots above or below the candles/bars. When the price reverses and the trend direction changes, the dots switch position — moving from below the price to above it, or vice versa:
Relative Strength Index (RSI). RSI is a leading oscillator displayed as a thin line that moves in and out of overbought and oversold zones — typically defined by the levels 30 and 70. It can also be used to identify divergences:
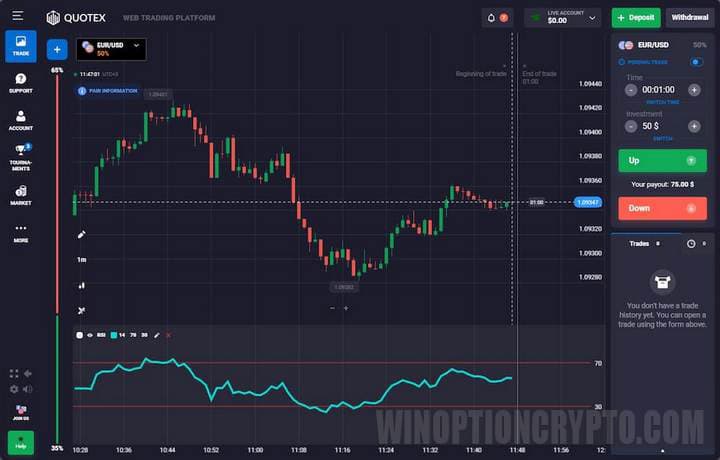
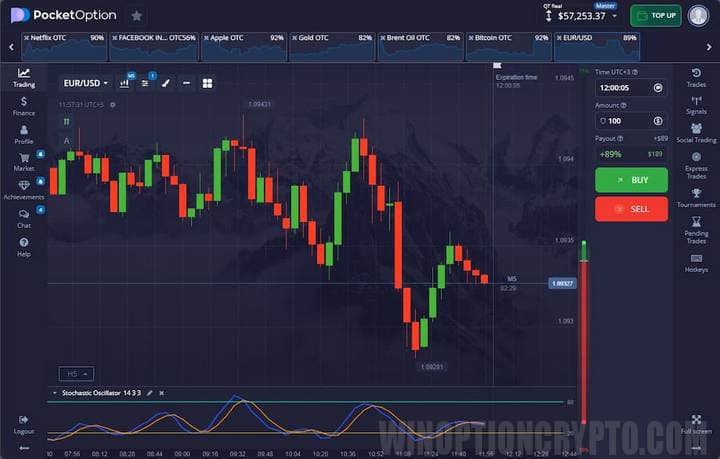
Stochastic Oscillator. The Stochastic Oscillator combines two lines — the fast "%K" and the slow "%D" — to assess the probability of price reaching an extreme and to gauge market momentum. A reading above 80 indicates that closing prices are approaching the upper boundary of the range (bullish conditions); a reading below 20 suggests proximity to the lower boundary (bearish conditions). A crossover of the "%K" and "%D" lines may signal a potential price reversal:
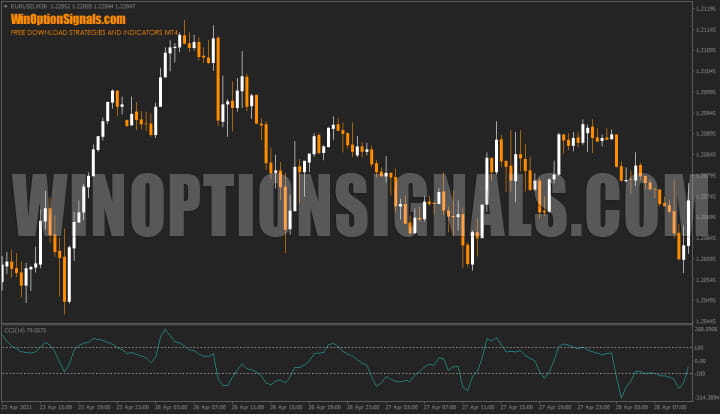
CCI. The Commodity Channel Index was originally designed for commodity market cycle analysis, but it can be effectively applied to binary options. The indicator's centreline is always at zero, with overbought and oversold boundaries at +100 and −100. When price moves beyond these levels, a potential reversal may be near:
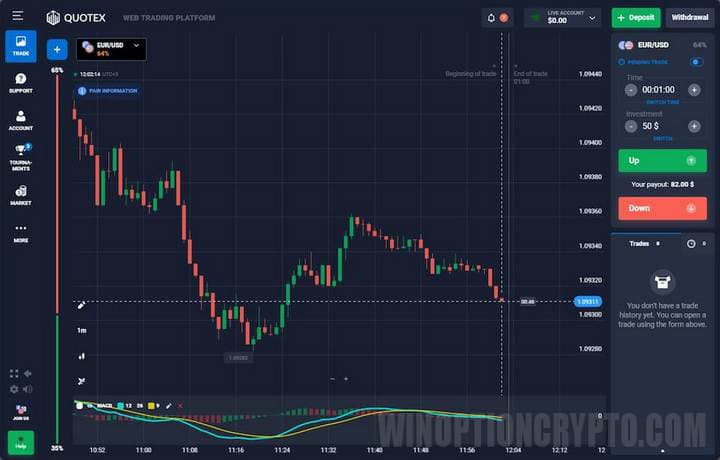
MACD. MACD combines the properties of a trend indicator and an oscillator. Its histogram shows the degree of convergence or divergence between two moving averages — one short-term and one long-term. In essence, MACD functions as a ready-made strategy for binary options analysis, capable of identifying not only the trend direction but also its strength:
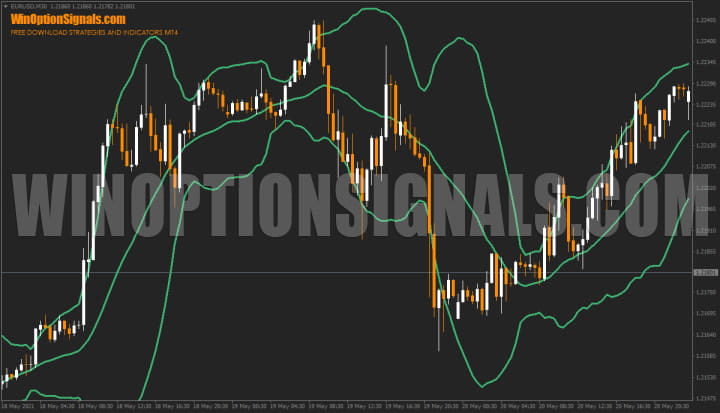
Bollinger Bands. Bollinger Bands consist of three Moving Average lines, two of which are offset from the central line by a set number of standard deviations — typically two. The bands widen and narrow with market conditions, marking extreme price levels and frequently generating useful entry signals:
Volumes in Technical Analysis of Binary Options
Volume is not the most common technical analysis tool for binary options, but some experienced traders do make use of it. Volume analysis helps determine whether market moves are genuine or simply price noise.
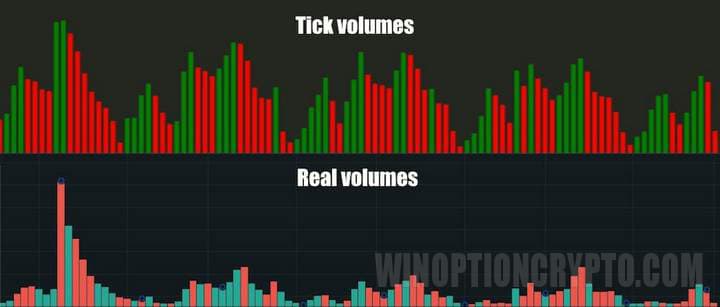
One challenge with volume analysis is that real transaction data is only available on regulated exchanges, making it unavailable for every asset. As a result, many traders rely on tick volumes as a practical alternative.
While tick volumes differ from real volume data, the gap is less significant than it might appear:
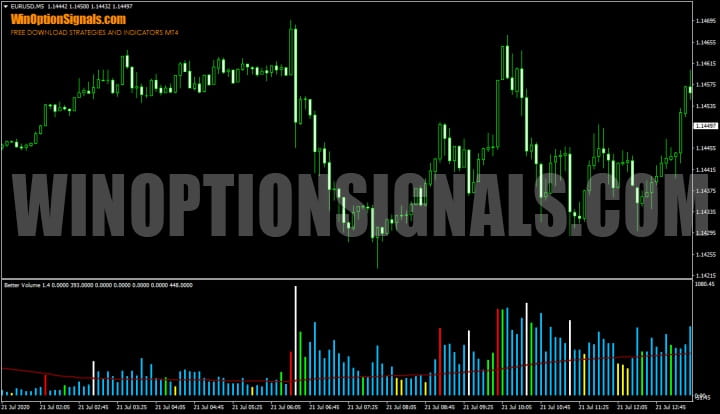
One of the most popular tick volume indicators is the Better Volume indicator, which color-codes histogram bars to indicate strength, weakness, false breakouts, and other market conditions:
You can learn more about how to correctly trade binary options using volume in our article: "Volumes in binary options trading."
Technical Analysis of Binary Options Without Indicators
It is entirely possible to trade binary options profitably on a clean chart without any indicators, and some traders base their entire strategy on this approach.
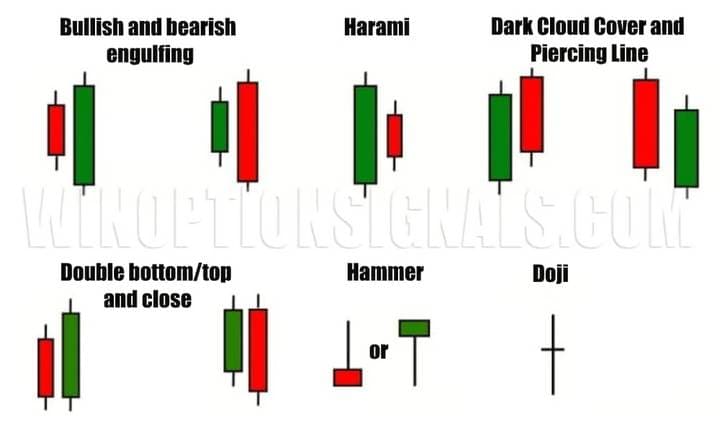
One such method is Price Action. Many professional traders conduct technical analysis by reading Japanese candlestick formations — which reflect shifts in supply and demand — to identify favorable trade entry points. This approach involves recognizing candlestick patterns such as the Pin Bar, Engulfing, and others. A number of these patterns are shown in the image below:
Given the large number of candlestick combinations that exist, the most practical way to track them is by using a candlestick pattern indicator.
It is worth noting that this type of analysis produces the best results when combined with volume analysis and the use of supply and demand zones (support and resistance).
Another approach based on Japanese candlesticks is described in detail in the book "Japanese Candlestick Charting Techniques" by Steve Nison.
Technical Analysis Patterns in Binary Options
Another popular indicator-free approach is trading with chart patterns, also known as graphical analysis of binary options. Chart patterns are price formations that indicate a potential upward or downward move. These patterns form repeatedly as price evolves over time. They are a reliable tool for both beginners and professionals, helping traders assess the likely price direction, anticipate bounces, pullbacks, and breakouts of support/resistance levels with a high degree of probability.
The most widely used formations include:
- triangles (ascending, descending, expanding, contracting);
- double and triple tops and bottoms;
- head and shoulders.
Let's take a closer look at each of these patterns.
The "triangle" pattern forms when price highs and lows gradually converge, and is generally considered a trend continuation pattern. There are several types of triangles, each with its own characteristics:
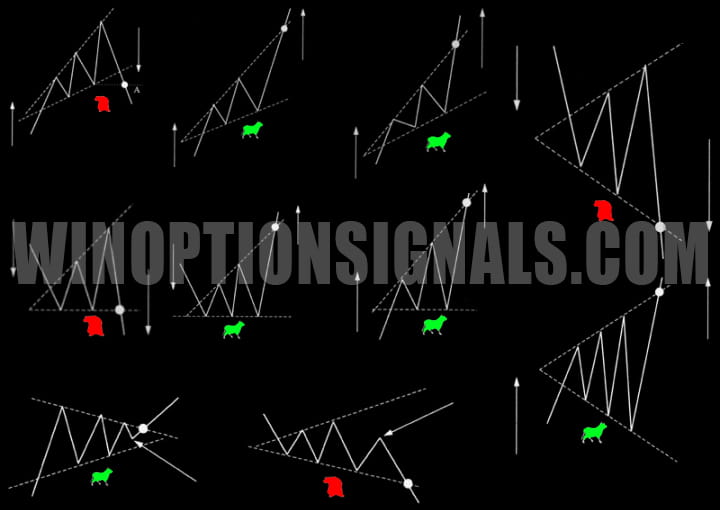
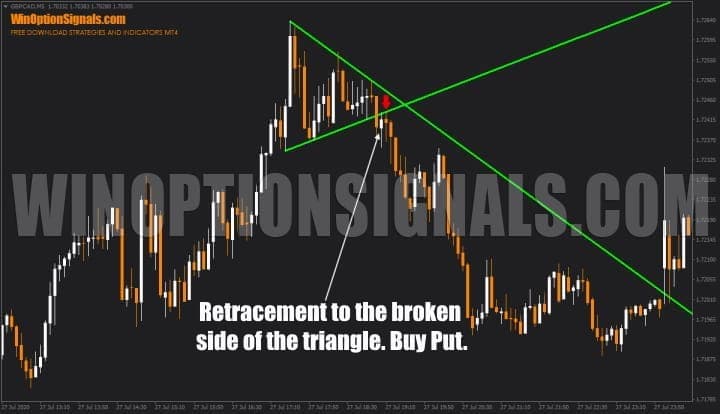
Here is an example of a triangle pattern on a chart:
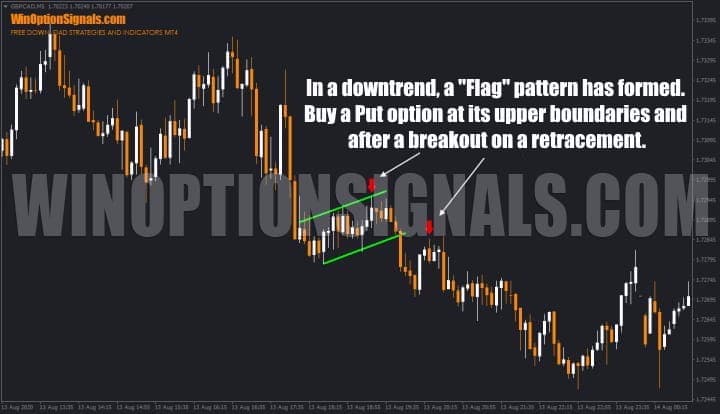
The "flag" pattern forms when price consolidates in a narrow range against the prevailing trend. It is a trend continuation pattern that can offer a well-timed entry. On the chart, a sharp impulse move creates the "flagpole," followed by a consolidation zone bounded by support and resistance — this is the "flag" itself.
If the consolidation stretches beyond 20 candles or bars, the formation may no longer be a flag but could instead signal a reversal and the start of a new trend. Entry opportunities include buying a Put from the upper boundary of the flag and a Call from the lower boundary. For greater accuracy, it is advisable to wait for confirmation — specifically, a breakout of the pattern:
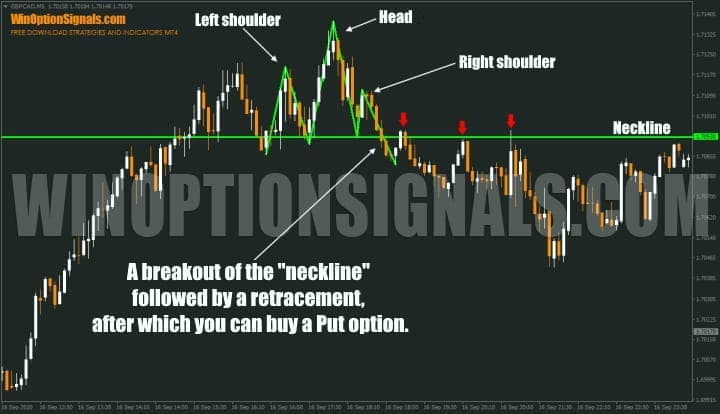
The "head and shoulders" is a reversal pattern consisting of two lower peaks flanking one higher central peak. It can be standard or inverted and appears in both uptrends and downtrends.
This pattern typically signals that buying or selling pressure is weakening. The formation of the second shoulder indicates the trend is losing momentum, as price can no longer set a new high or low. The most critical element of this pattern is the neckline — the pattern is only considered complete once price breaks through this level and a candle closes beyond it:
The "double top" or "double bottom" is also a reversal pattern, consisting of two peaks of roughly equal height. After the first peak, price pulls back, then returns to approximately the same level before pulling back again — signaling that quotes may decline further. In the double bottom, the same logic applies in the opposite direction:
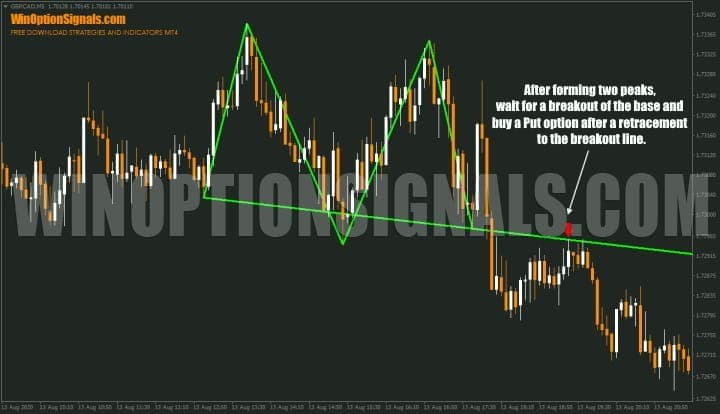
You can also use the Price Patterns indicator to automatically detect these chart formations.
Support and Resistance Levels
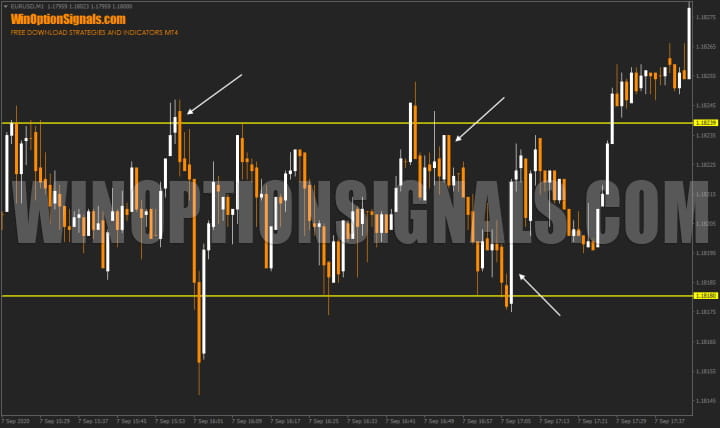
Support and resistance are fundamental concepts in trading. These are price levels from which the market has previously reversed. The trader's goal in technical analysis is to correctly identify these zones, as price approaching them significantly increases the likelihood of a sharp reversal. Support is drawn using two prior lows; resistance is drawn using two prior highs. The closer price gets to these levels, the higher the probability of a bounce. A decisive breakout through a level may signal a trend change:
Independent Technical Analysis of Binary Options
To make technical analysis more manageable — especially for beginners — it helps to follow a few simple guidelines:
- Binary options brokers. Choosing the right broker is critical, as platform quality directly affects order execution speed and accuracy — which in turn impacts profitability. It is also worth checking whether the trading platform includes the indicators and charting tools you need. Brokers such as Quotex, Pocket Option, and Deriv offer everything necessary for binary options analysis.
- Chart setup. If the platform displays a line chart by default, switch to Japanese candlesticks or bars, which are far more informative and allow for a quick visual read of price movement.
- Selecting a trading instrument. Beginners are advised to start with currency pairs that have moderate volatility. EUR/USD is one of the most suitable options.
- Identifying the trend. Trend identification is the cornerstone of binary options technical analysis, as most tools perform best in trending conditions.
Technical analysis is a complex subject for novice traders, and no single article can cover everything. Developing a real understanding of market dynamics requires experience, ongoing study, practice on a demo account, and working through books on binary options trading.
Conclusion
Technical analysis can be a powerful tool for binary options trading, but it is essential to study it properly and select the approach that best suits your style and understanding.
Regardless of which type of technical analysis you use, it is important to trade with the trend, as most indicators and patterns are far less reliable in flat (sideways) market conditions.
And of course, never overlook capital and risk management. Successful trading!

To leave a comment, you must register or log in to your account.