There is a well-known saying in financial markets: "The trend is your friend." While this makes intuitive sense, putting it into practice is another matter. What exactly is a trend in the Forex market, and how do you identify it for successful binary options trading?

Table of contents
- What is a trend?
- Identifying the trend.
- Using price action to identify a trend.
- Moving averages for identifying the trend.
- Bill Williams' fractal indicator for identifying the trend.
- The ADX indicator for identifying the trend.
- Why do trends form and what sustains them?
- Effective trend trading.
- Conclusion.
What Is a Trend in Binary Options?
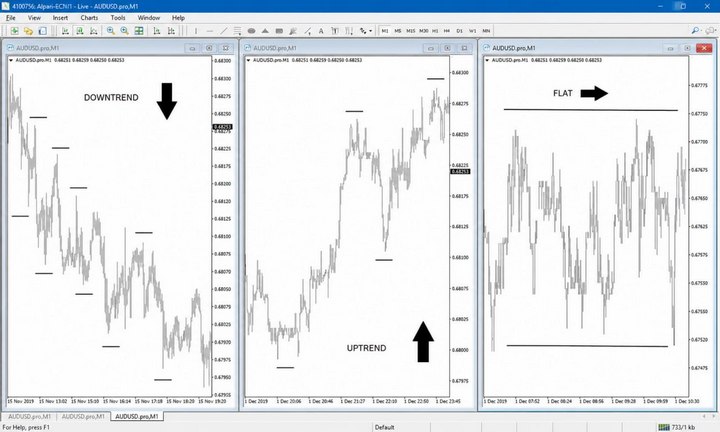
A trend in financial markets is the general direction in which market prices or the value of an asset are moving. Trends can be upward (bullish), downward (bearish), or sideways (flat/consolidating). There is no fixed timeframe threshold that defines a trend, but the longer a direction persists, the stronger and more established the trend becomes.
Identifying the Trend in Binary Options
The most straightforward way to identify a trend is to observe price behaviour directly. Traders who rely on technical analysis consider a clean price chart sufficient to determine the prevailing trend type.
How to define the trend type:
- An upward (bullish) trend is in effect when successive highs and lows are consistently rising.
- A downward (bearish) trend is in effect when successive highs and lows are consistently falling.
- A sideways (flat) trend is in effect when highs and lows remain within a defined price range, bounded by horizontal support and resistance zones.
Using Price Action to Identify a Trend
Trending markets — both upward and downward — suit swing traders who can set wider profit targets, while sideways (flat) markets are better suited to scalpers and intraday traders seeking quick profits from short-range moves. To identify optimal entry and exit points, trend traders use trend lines and support and resistance zones.
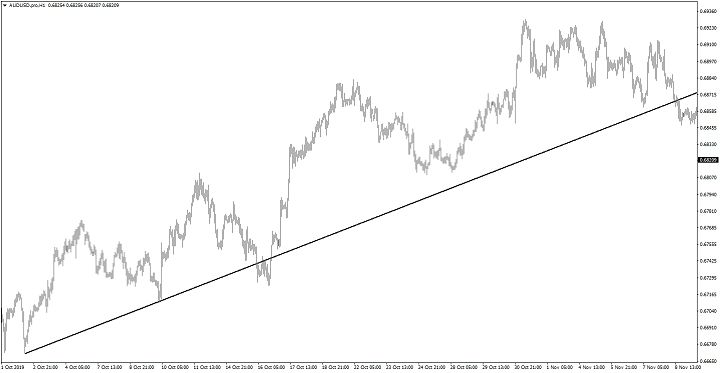
In an uptrend, a line is drawn from a specific price low, connecting it to a subsequent higher low, and projected forward. This line acts as a dynamic support zone, with optimal Call entry points occurring when price touches or approaches the trend line.
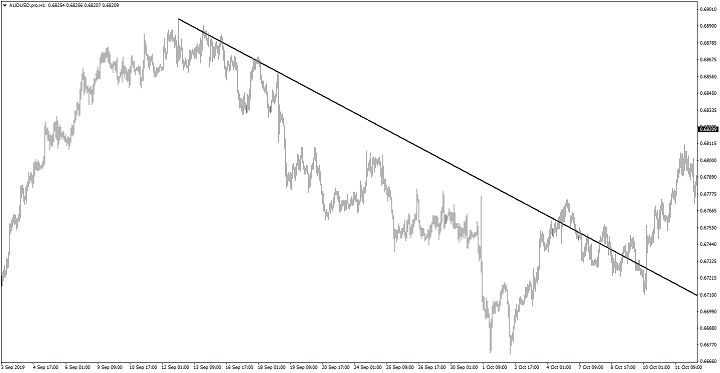
In a downtrend, a line is drawn from a specific price high, connecting it to a subsequent lower high, and projected forward. This line acts as a dynamic resistance zone, with optimal Put entry points occurring when price touches or approaches the line.
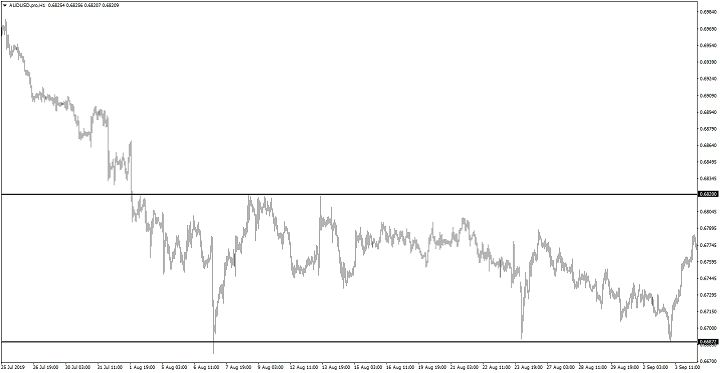
In sideways markets, horizontal lines are drawn along clearly defined support and resistance price levels. Traders look to place buy orders when price is at or near support, and sell orders when price is at or near resistance.
Not all traders prefer a clean chart, however. Many use additional tools to identify the trend when trading binary options. Below we cover the main technical analysis indicators used for trend identification.
Moving Averages for Identifying the Trend
Moving averages (SMA) are among the oldest and most widely used technical analysis indicators. They help identify trend direction, measure trend momentum, and anticipate potential reversals. By smoothing price movement, a moving average makes the prevailing trend direction easier to read at a glance.
When price holds above the moving average, an uptrend is considered active. Trend momentum can be assessed by the slope of the moving average — the steeper the angle, the stronger the price movement in that direction.
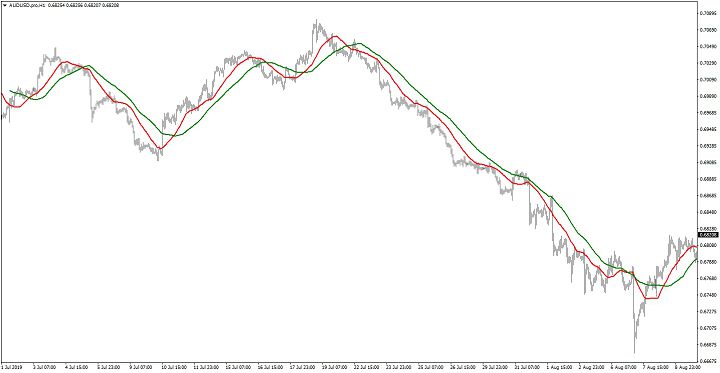
Traders often combine multiple moving averages for more reliable analysis. This allows them to confirm the prevailing trend and identify potential reversals at an early stage. When the faster moving average crosses above the slower one, an uptrend is confirmed; when it crosses below, a downtrend is confirmed.

Bill Williams' Fractal Indicator for Identifying the Trend
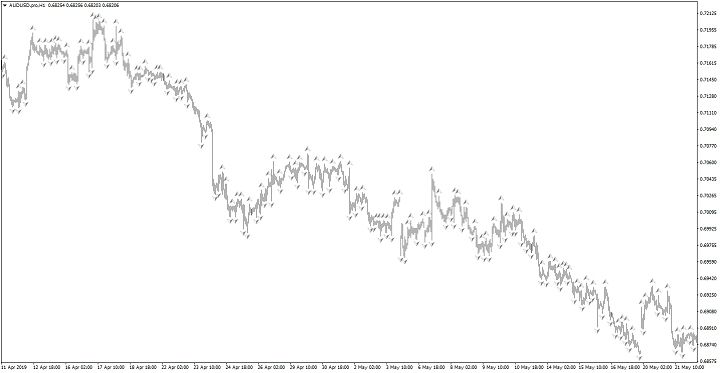
The idea behind this indicator is that markets are fractal in nature — within apparent chaos, repeating patterns emerge that, when identified, can reveal profitable trading opportunities. Bill Williams Fractals is a visual indicator that helps traders observe the cyclical behaviour of the market, identify strong trend entry points, and spot potential reversals early.
Our website features the "Trading Chaos" strategy by Bill Williams, adapted for binary options and incorporating fractals.
A fractal marks extreme price levels across five consecutive price bars. An upward fractal has a middle candle with the highest high, flanked by two candles with lower highs on either side. A downward fractal has a middle candle with the lowest low, flanked by two candles with higher lows.
While this indicator alone is not sufficient for making trading decisions, it is highly effective for identifying trend direction. By observing fractal patterns, traders can readily determine whether the prevailing market condition is an uptrend, a downtrend, or a sideways market.
The ADX Indicator for Identifying the Trend
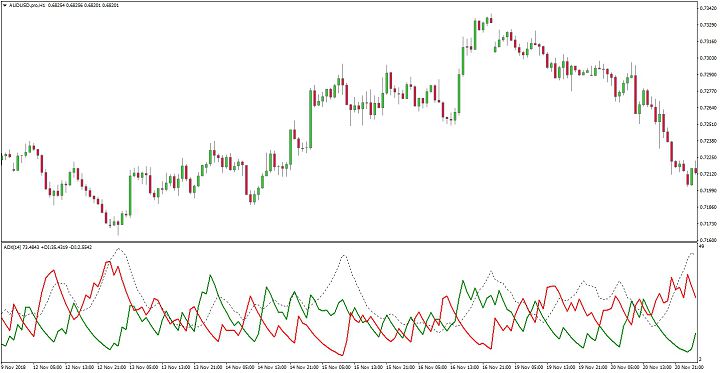
The Average Directional Index (ADX) is a widely used oscillator that measures both trend direction and trend strength. It oscillates between 0 and 100, and is accompanied by two directional lines: +DI (green) and −DI (red). When +DI is above −DI, an uptrend is indicated; when −DI is above +DI, a downtrend is indicated. When the two lines converge, it suggests a consolidating or flat market.
The ADX midpoint value of 50 is also worth monitoring. An ADX reading above 50 indicates a strong trend; a reading below 50 suggests the move is losing momentum, which can serve as an early warning of a potential trend change.
Why Do Trends Form and What Sustains Them?
Being able to identify and trade a trend is important, but understanding what creates and sustains trends is equally valuable. The primary drivers are fundamental factors and market sentiment.
As an example of fundamental influence, consider a company's share price — it often reflects the company's underlying financial strength. A rising price may reflect strong execution of a business plan, or expectations of higher future revenues and profits.
Currencies rise or fall in response to interest rates, employment data, trade balances, and other macroeconomic factors in the underlying country. To stay informed of relevant upcoming events, use the economic calendar.
Trends can also be created and sustained by technical market dynamics. The collective behaviour of traders around the world defines areas of support and resistance.
For example, in an uptrend, when price breaks above a significant resistance level, many traders are drawn into the move — either entering new positions or adding to existing ones. This increases demand and supports further price gains, even in the absence of any notable fundamental change.
Human psychology also plays a role. Fear, greed, and confidence are the primary emotions that influence trader behaviour, and in aggregate they shape prevailing market sentiment.
When collective fear dominates, sentiment turns negative and bearish movement tends to follow. When greed is the prevailing emotion, sentiment turns positive and an upward trend is more likely to take hold.
Effective Trend Trading
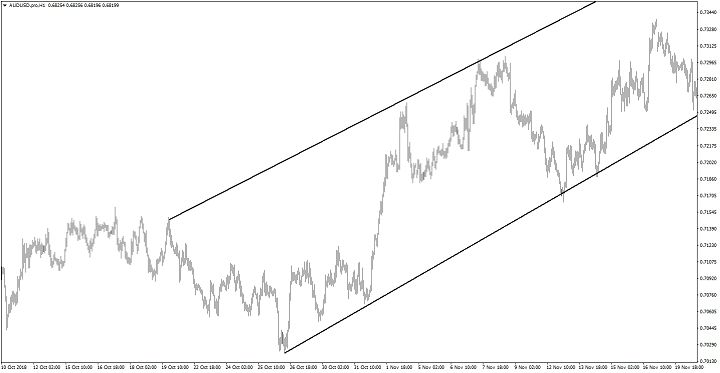
Identifying a good trend entry point is only part of the equation — the success of any trade is ultimately determined by the exit. When combining price action with trend lines, using price channels is a practical approach.
Channels are pairs of parallel trend lines drawn along both price highs and lows. They are well suited to placing profit targets. In an uptrend, for example, the upper channel line represents an area where price may begin to pull back — making it a natural level to consider closing a long position.
Conclusion
The trend truly is your friend. Trading with it — in Forex or in binary options — gives you a meaningful edge. With the right application of price action techniques and the indicators covered above, you can position yourself to enter trades in the direction of the trend as soon as the signals appear. Follow the rules, and the trend will work in your favour.
See Also:
- How do binary options brokers make money
- How to choose a binary options broker
- Binary options are a scam
- How to make money on binary options
To leave a comment, you must register or log in to your account.