Traders who have worked with volume data on traditional exchanges might assume that volume analysis cannot be applied to binary options — but this is not the case. Binary options can be traded on currency pairs, stocks, and cryptocurrencies, and on both stock exchanges and cryptocurrency exchanges, volume data is available to any trader.

Contents:
- What are volumes in binary options and where do they come from?
- Vertical volumes in binary options
- Horizontal volumes in binary options
- Volume and trend movements
- Where to access volume data for binary options
- How to trade binary options using volume
- Conclusion
What Are Volumes in Binary Options and Where Do They Come From?
Regardless of the market or the phase of the trend, price tends to move in waves. Looking more closely at these waves, it becomes clear that price moves from zone to zone — between support and resistance levels, or between supply and demand zones. When demand prevails, price rises and stalls at supply levels. When supply prevails, price stops and reverses at demand levels. These dynamics can be shown schematically:
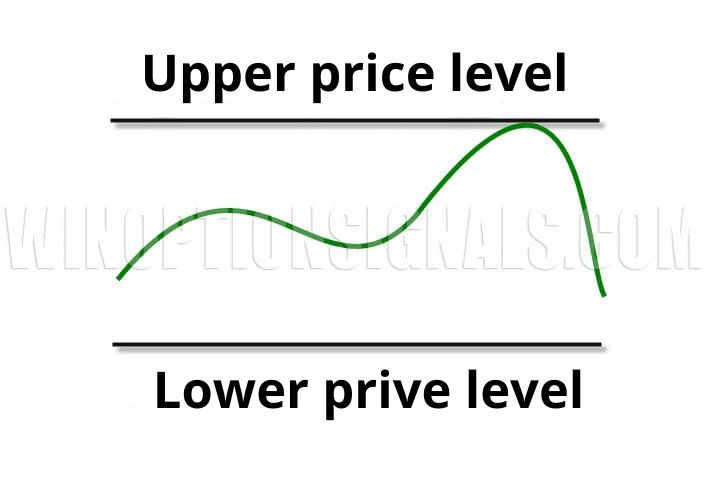
The lower level is support (demand) and the upper level is resistance (supply). When price reaches the lower level, many traders conclude that the asset is undervalued and begin buying. When price reaches the upper level, the reverse happens — the asset appears overvalued and selling activity increases. In the example above, as soon as price reached the upper level (resistance), a surge of selling drove the price back down.
It is worth noting that sales occur not only as market orders but also through pending orders — which is why these areas are better described as zones rather than precise price levels, since transactions are distributed across a range of prices rather than occurring at a single point.
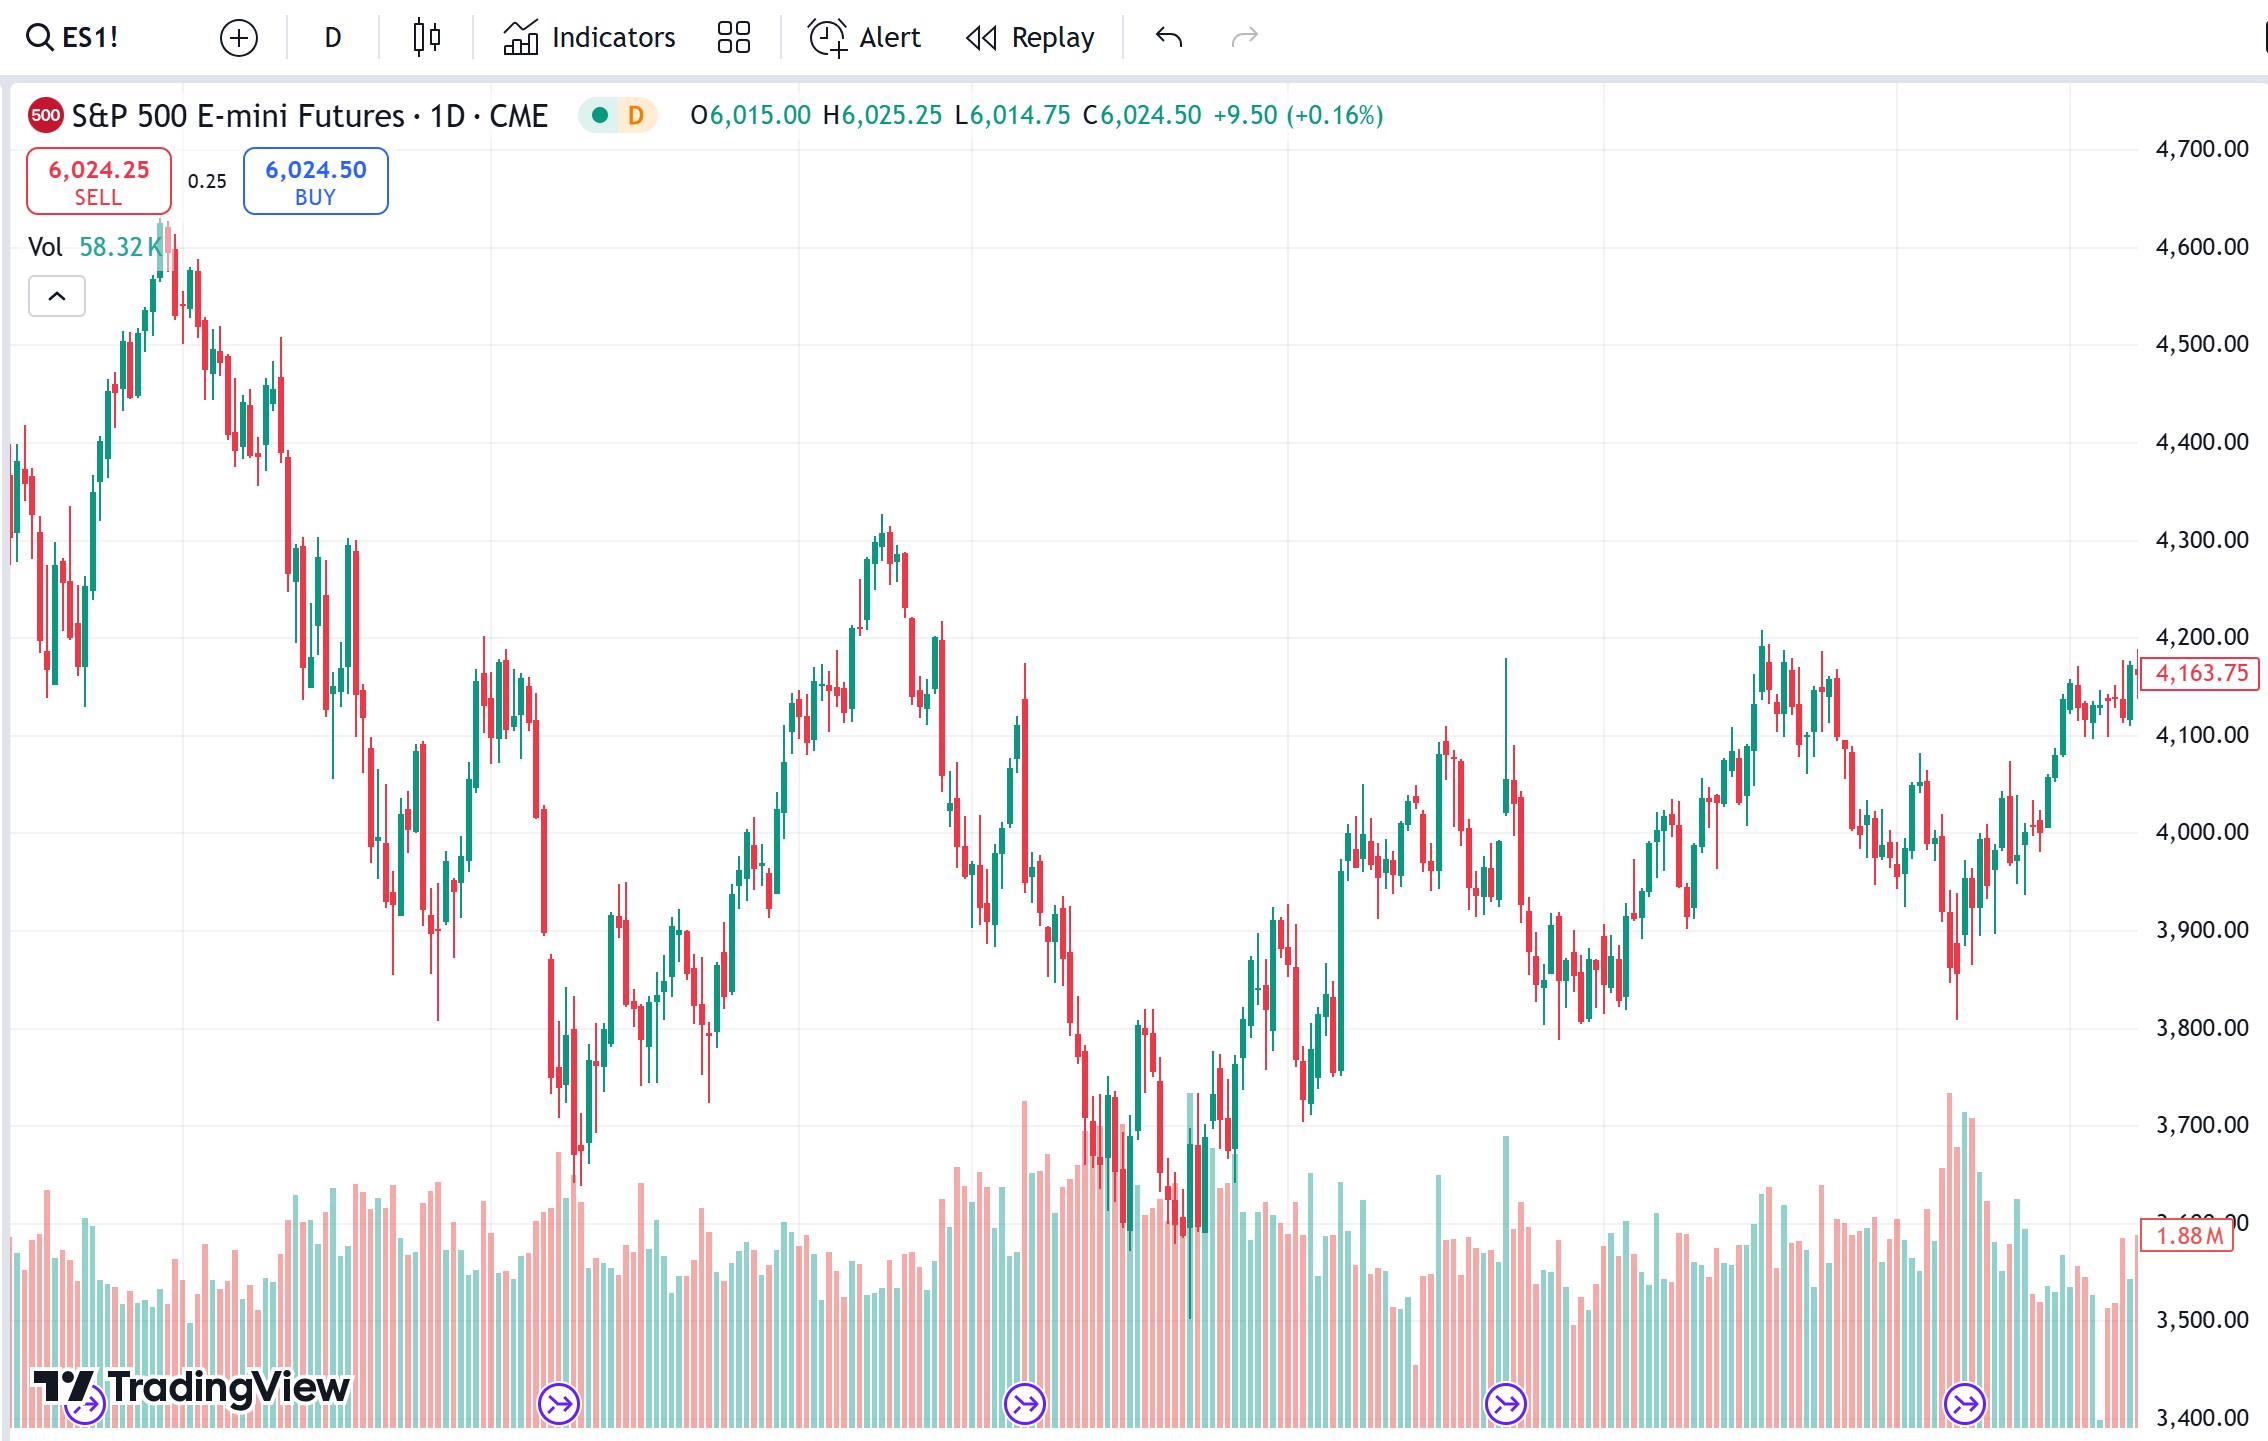
When price reaches the lower level, traders who were short begin closing their positions by buying back the asset, and are joined by new buyers attracted by the low price. This buying activity causes price to rise, and as the move develops, additional traders join in — which increases trading volume:
Vertical Volumes in Binary Options
Understanding the supply and demand dynamics above makes it clear why volume spikes in certain places and remains low in others. High volume accompanies periods of intense trading activity. During a flat, volume is typically low because price fluctuations are confined to a narrow range. Applying volume to the earlier examples, a reversal from the resistance level would look like this:
While the market was ranging, volume was low. As price approached a level of interest, transaction volume increased sharply. The same pattern occurs at the lower level:

Buying activity increases, and volume rises further as new traders join the upward move. Vertical volume also acts as confirmation for candlestick patterns. If a long-wick candle such as a pin bar appears alongside an abnormally high volume bar, the signal's reliability increases considerably. This indicates a genuine battle between buyers and sellers within that wick, with the winning side likely to continue pushing price. Without volume confirmation, such a candle may be nothing more than market noise.
Horizontal Volumes in Binary Options
Tick volumes in binary options are not limited to the classic vertical histogram that shows the volume of each bar in a separate panel below the chart. They can also be used for cluster analysis, and on that basis, to build a market profile — also known as horizontal volume.
Horizontal volume reflects the number of completed transactions at a given price level. Indicators display this information in various ways, but most commonly as a horizontal histogram along the left or right side of the chart — as the VP6 Range indicator does:
The Market Profile concept was developed by J. Peter Steidlmayer, who in 1984 explored the significance of volume in level-based trading and represented it as horizontal volume distributions. According to Steidlmayer's theory, the market always seeks balance, which is reflected visually as a bell-shaped distribution:
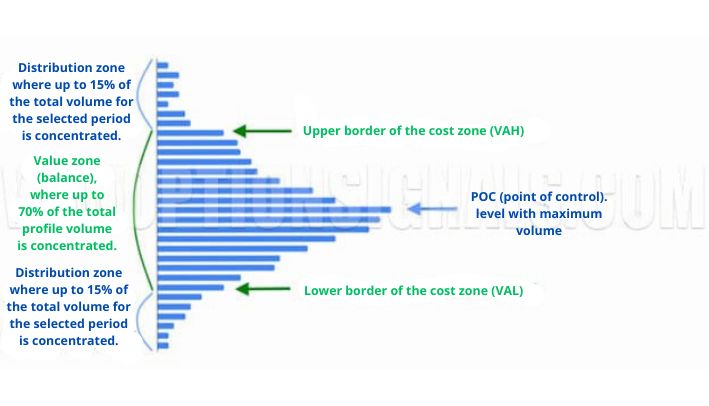
The value area — the central part of the bell — is where buyers and sellers are in equilibrium near the fair price. Approximately 70% of all transactions occur here. The price level with the highest volume for the analysed period is called the Point of Control (POC).
The POC (Point of Control) represents the "fair price" for the period under analysis. When price trades above the POC, this level acts as strong support. Trading a bounce from the POC is considered one of the most conservative and reliable approaches in binary options. When price returns to this high-accumulation zone after an extended absence, the probability of a pause or reversal exceeds 70% — making it well suited for trades with an expiration of 3–5 candles.
Outside the value area, the market is in a state of imbalance as the dominant side — buyers or sellers — seeks a new fair price. Strong trend moves typically develop in these distribution zones.
In a state of imbalance, price tends to return to the value area or form a new one. The VAH, VAL, and POC levels therefore function as price magnets, attracting price back toward them. These levels act as support and resistance and form the basis of volume-based trading systems such as ASG GRAAL VOLUME SISTEM.
Volume and Trend Movements
During a trend, volume provides additional context and can indicate entry opportunities. In an uptrend, increased volume accompanies not only new highs but also the corrections that offer entry points for binary options traders:
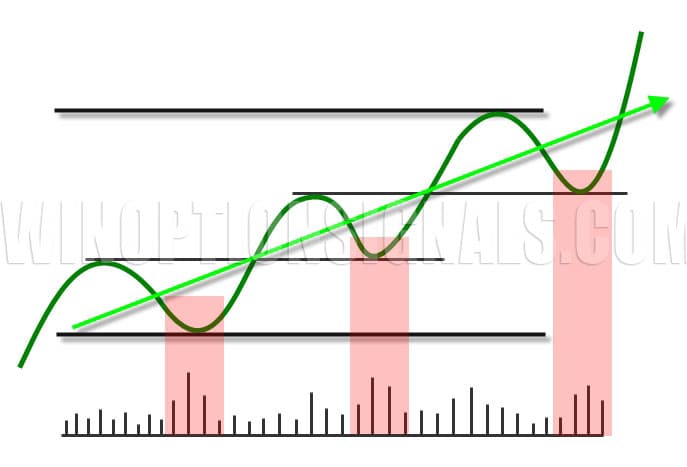
As the chart shows, upward moves are accompanied by rising volume, and pullbacks also see elevated activity as new traders add to positions or short sellers exit. The most reliable entry points during a rising market are corrections — price pulls back, offering a better entry price for a Call option.
During a downtrend, the dynamics are similar. Pullbacks with elevated volume can be used to enter Put positions.
During a flat, volume is worth watching in two specific situations:
- When price approaches a boundary. If volume begins to increase as price nears the boundary of the range, this signals that a bounce is likely.
- On a breakout from the flat. If volume increases on the breakout candle, this confirms that the move is genuine and price is likely to continue in the breakout direction.
Where to Access Volume Data for Binary Options
There are two types of volume data available to traders:
- Exchange (real) volume.
- Tick volume.
Both can be used for analysis, but real exchange volume is significantly more informative, as tick volume is constructed from the number of price ticks rather than from actual transaction data.
Real volume for binary options
Many terminals and trading platforms provide real volume data for various markets. However, there is no completely free source that provides real-time volume data for all markets around the clock. Partial access is available through TradingView:
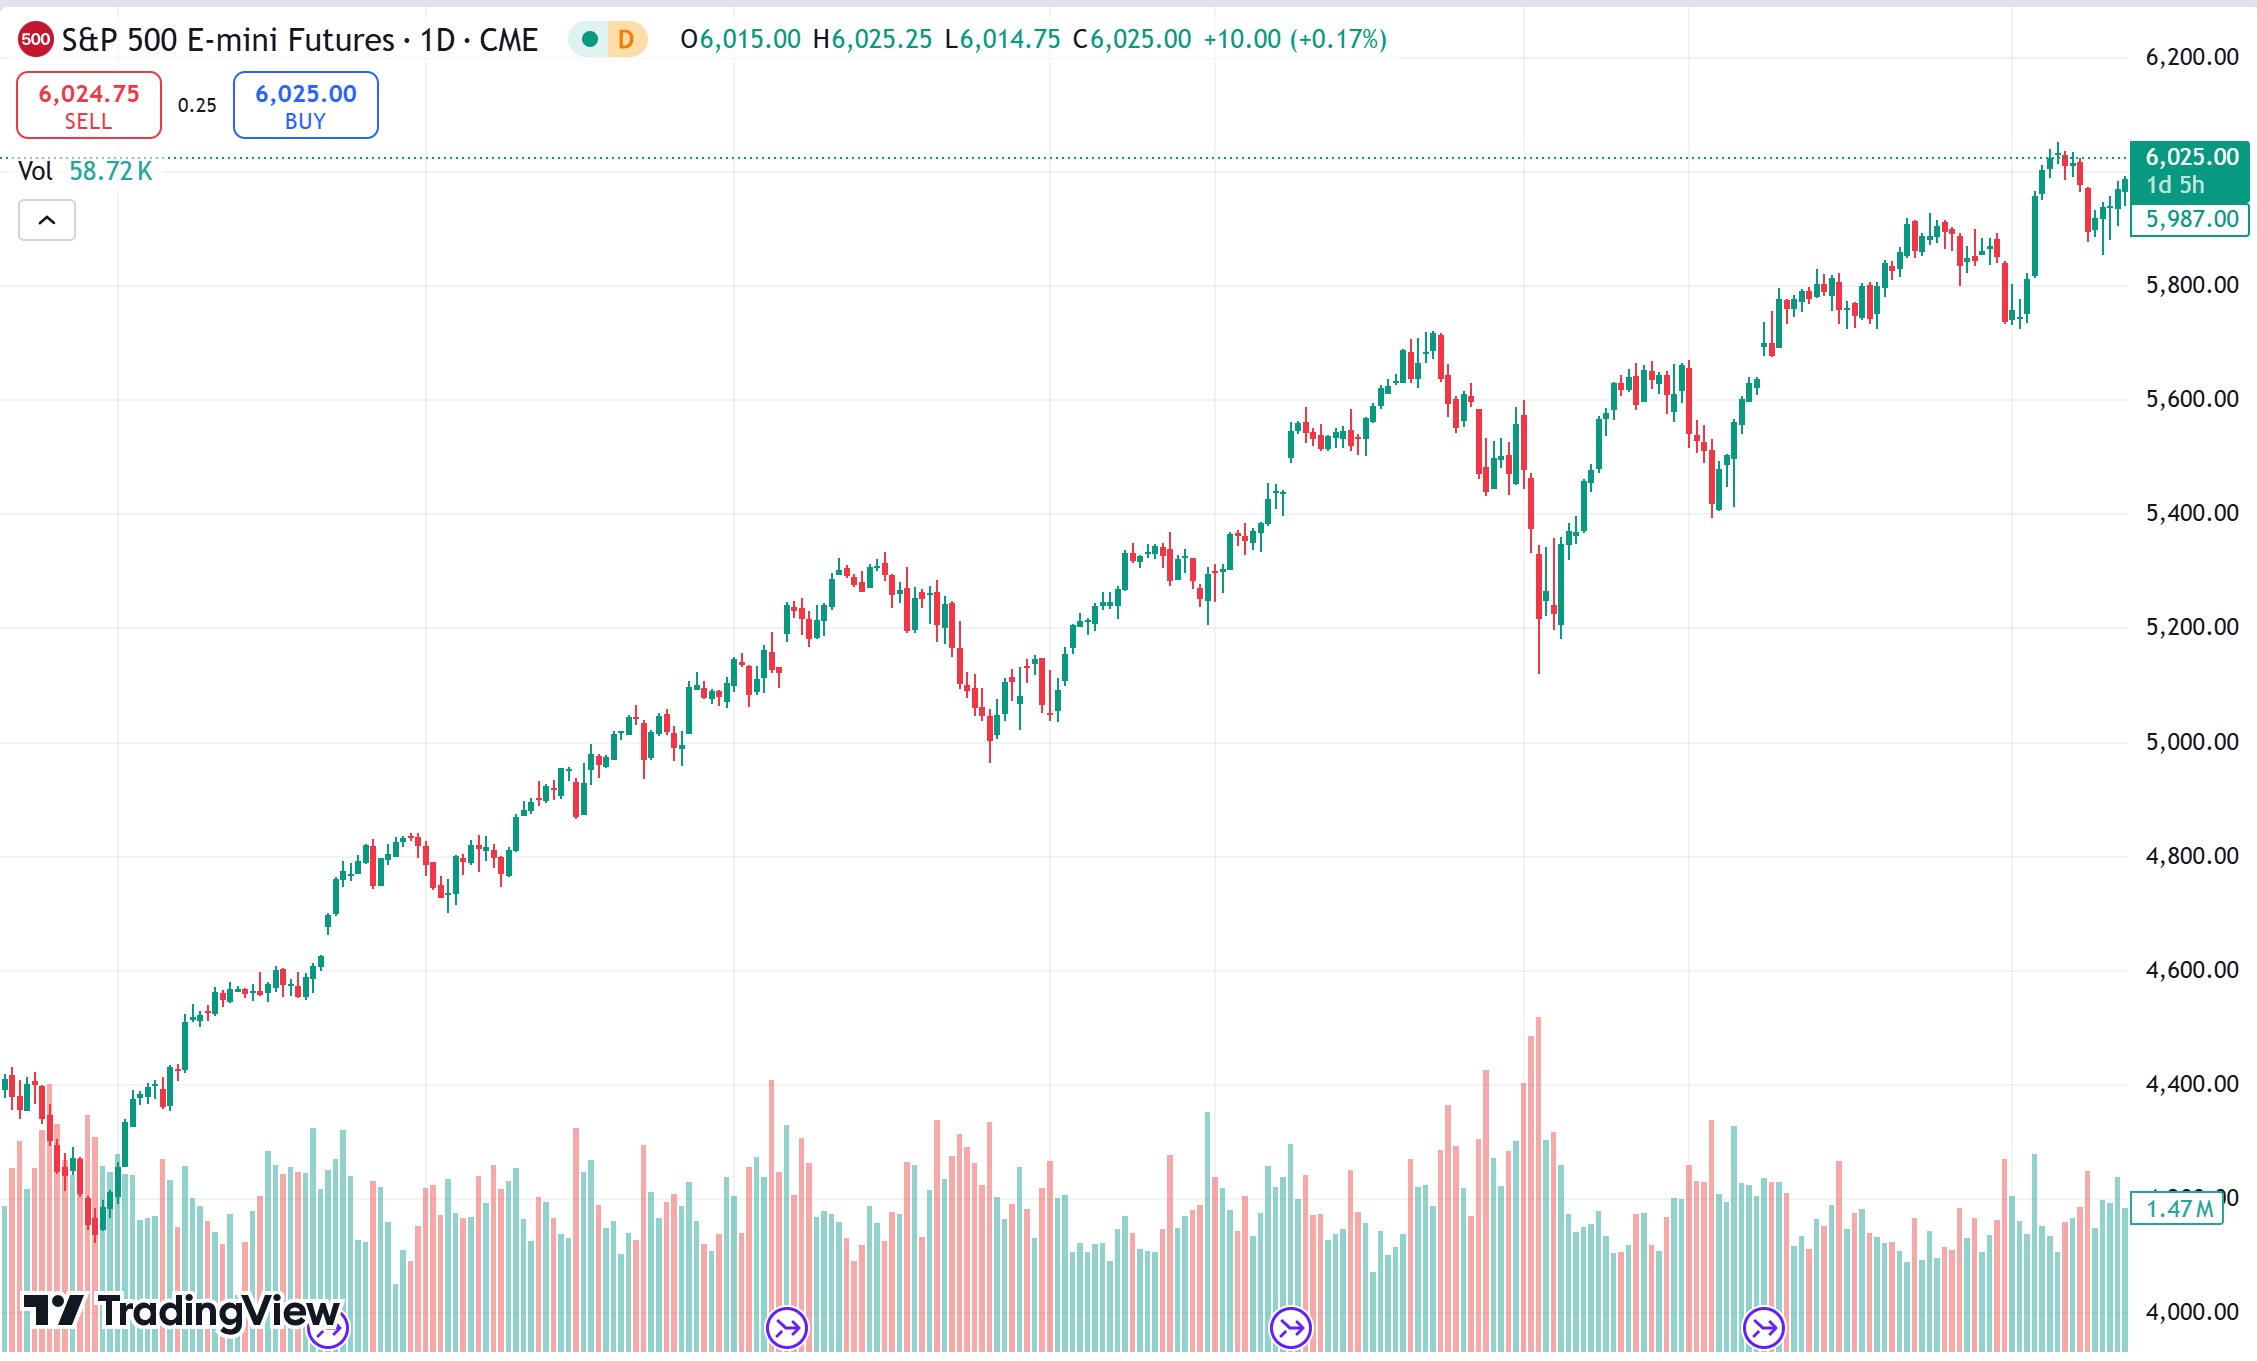
On the free TradingView plan, historical volume is readily available, but real-time quotes are delayed by 10 minutes. This limitation is most relevant on short timeframes (M1–M15). On hourly charts, a 10-minute delay rarely affects analysis meaningfully, so volume-based analysis remains usable on a free subscription. A paid plan provides real-time data from any major exchange, including intraday and second charts.
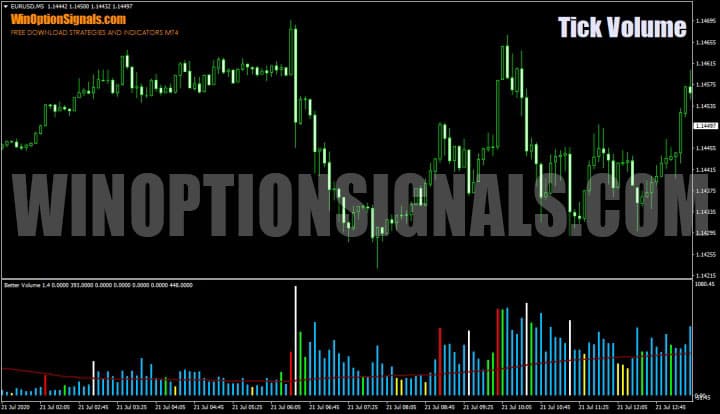
Tick volume for binary options
Tick volumes are available both on the live chart on our website and in terminals including MetaTrader 4:
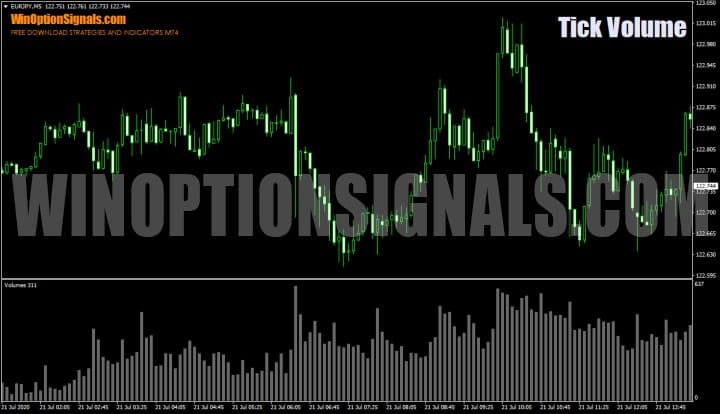
The MT4 volume indicator displays tick volume — which is based on the number of price changes rather than actual transactions — but it can still be used effectively once you understand its characteristics. A useful alternative is the Better Volume indicator, which offers a refined calculation of tick volume:
There are also many other binary options indicators that use their own algorithms for computing tick volume.
Comparing real and tick volume side by side, the two tend to align closely in most cases:
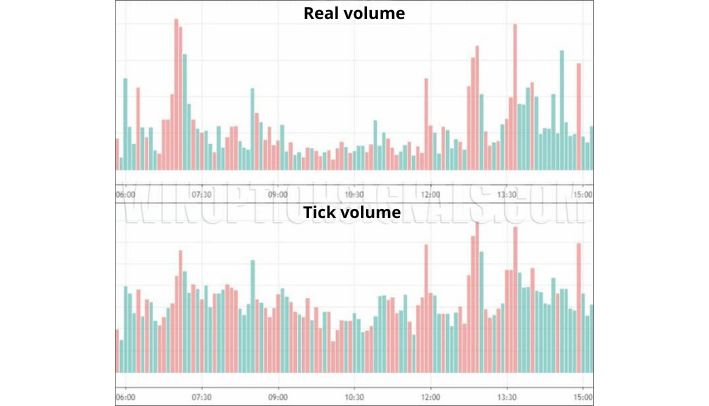
As the image shows, almost every spike in tick volume closely mirrors the corresponding spike in real volume. These spikes — rather than the volume on every individual bar — are what matter for practical analysis.
How to Trade Binary Options Using Volume
Volume can be applied to binary options in various ways, and developing genuine fluency with this type of analysis takes time. The two most accessible approaches have been covered earlier in this article.
Note that currency pairs do not have exchange-based real volume. For currency pair analysis, currency futures can be used instead — the examples below use the Euro FX futures contract (6E).
Trading from level boundaries with volume confirmation
When trading a range or from specific level boundaries, observe volume as price approaches the boundary:
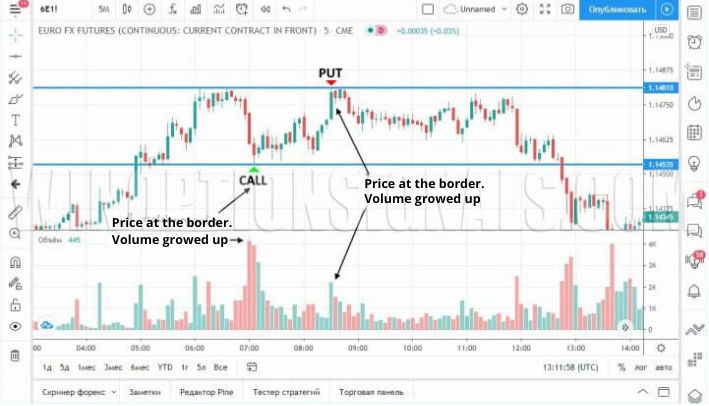
As shown, volume increases sharply when price reaches the level, signalling that meaningful activity has arrived and traders are beginning to buy or sell.
Trading the Engulfing pattern with volume confirmation
Volume pairs well with candlestick patterns. The Engulfing pattern — where a new candle fully covers the range of the previous one — becomes a stronger signal when accompanied by elevated volume:
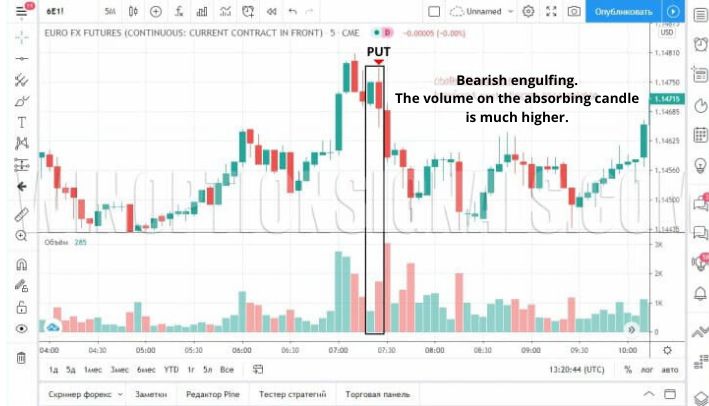
As shown, price moved in the direction of the bearish engulfing pattern following the signal.
Conclusion
As this article has shown, volume analysis can be a useful and profitable addition to binary options trading when applied correctly. Before using volume in live trading, spend time studying it on a demo account — understanding how volume behaves across different market conditions is essential before committing real capital.
As with any approach, apply sound money management and risk management rules consistently. These protect the deposit even through extended losing periods.

To leave a comment, you must register or log in to your account.