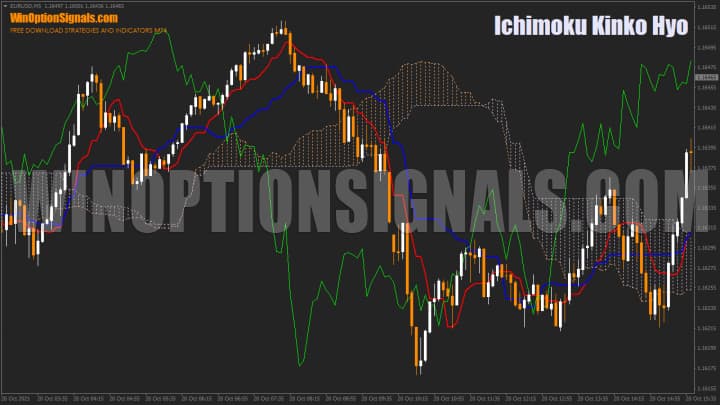
The Ichimoku strategy for binary options is based on the indicator of the same name, which stands out due to its distinctive operating algorithm. The Ichimoku indicator is a price-tracking tool that, through several complementary parameters, improves forecasting accuracy when working with a trend. Applied to binary options trading, this indicator can deliver strong results when its signals are used correctly.
The Ichimoku trading indicator (Ichimoku Kinko Hyo) is a comprehensive market analysis tool developed by Japanese analyst Goichi Hosoda. The author designed it to serve four purposes:
- simplifying the use of candlestick analysis;
- identifying bullish and bearish trends;
- locating support and resistance zones;
- generating signals for trade entries.
The Ichimoku indicator remains a popular foundation for trading systems to this day. Its proven track record, ease of use in analyzing market movements, and reliable signals are why traders continue to build modern trading systems around it. Its calculations help any trader focus on market trends and extract more consistent profits.
Ichimoku Indicator: Setup in MT4 and How It Works
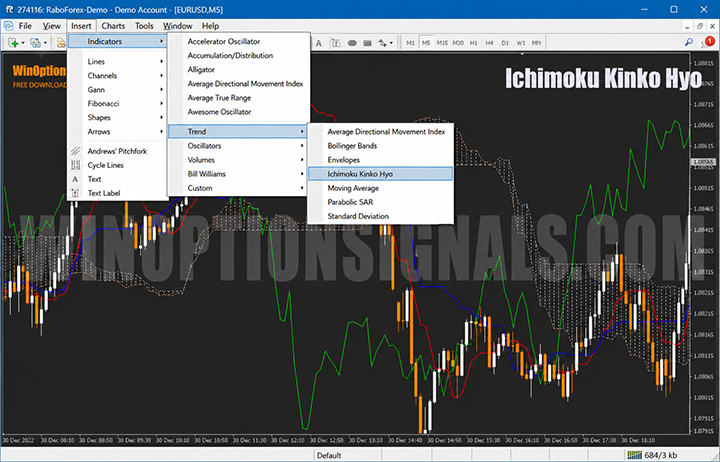
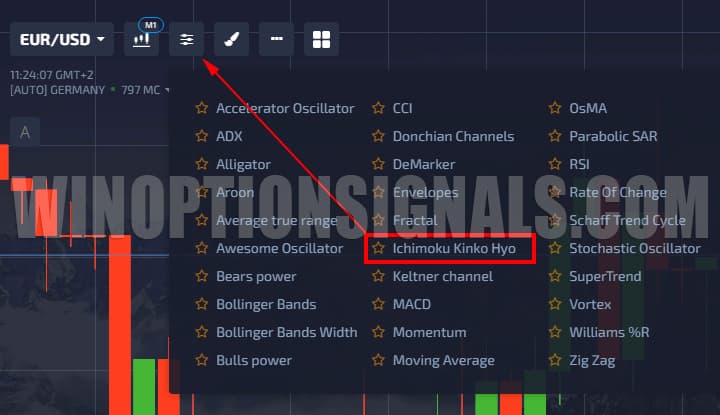
The Ichimoku indicator is built into MetaTrader 4 — no installation is required. To add it to a chart, go to the Insert menu, select Indicators, then Trend, and choose Ichimoku Kinko Hyo:
The default settings can be left unchanged.
As a trend indicator, Ichimoku reliably identifies market direction along with its relative strength or weakness. The combined set of signals it provides makes it easier for traders to read the market by identifying:
- price direction;
- the end of a price correction;
- the completion of a price impulse;
- the transition to an accumulation phase.
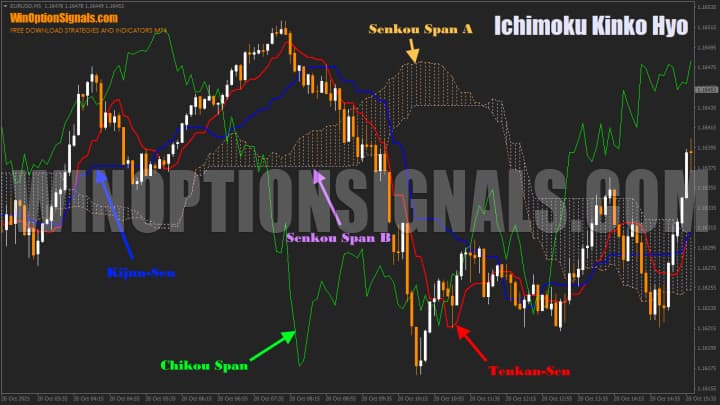
The Ichimoku indicator displays five lines on the chart:
- Tenkan-Sen — a reversal line representing the median price moving average with a period of 9;
- Kijun-Sen — the baseline, representing the median price moving average with a period of 26;
- Chikou Span — a lagging line that plots closing prices displaced into the past;
- Senkou Span A and Senkou Span B (together known as Kumo, or the "cloud") — calculated from the averages of Tenkan-Sen and Kijun-Sen, shifted forward by 26 and 52 periods respectively.
How to Use the Ichimoku Kinko Hyo Indicator
Once the Ichimoku Cloud indicator is added to a chart, it generates a large number of signals. In order of significance (from weakest to strongest), these can be grouped as follows:
- Tenkan-Sen line readings (displayed in red);
- Kijun-Sen line readings (displayed in blue);
- Chikou Span signals (displayed in green);
- price position relative to the Ichimoku cloud (Senkou Span A and Senkou Span B).
The Tenkan-Sen line provides a quick read of current market sentiment:
- The direction of the line indicates which side is dominant in the short term — an upward slope favors Call options, while a downward slope favors Put options.
- A horizontal Tenkan-Sen indicates balanced market forces — a sign of consolidation.
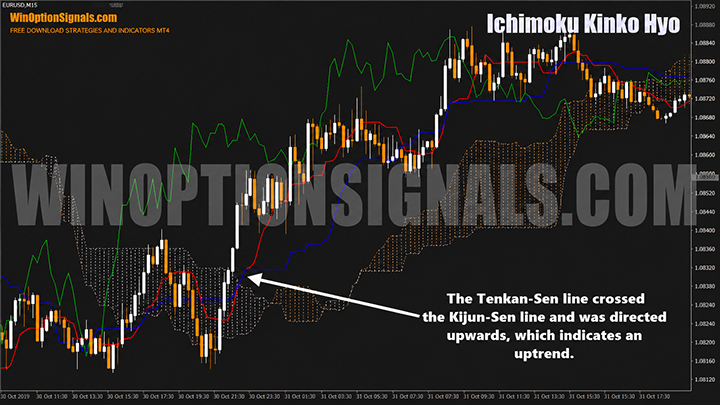
- A Tenkan-Sen cross above Kijun-Sen signals bullish dominance and is a Call entry signal; a cross below signals bearish dominance and favors Put options.
Despite its usefulness, the Tenkan-Sen is considered a short-term indicator and is treated as a weak signal for binary options entries:
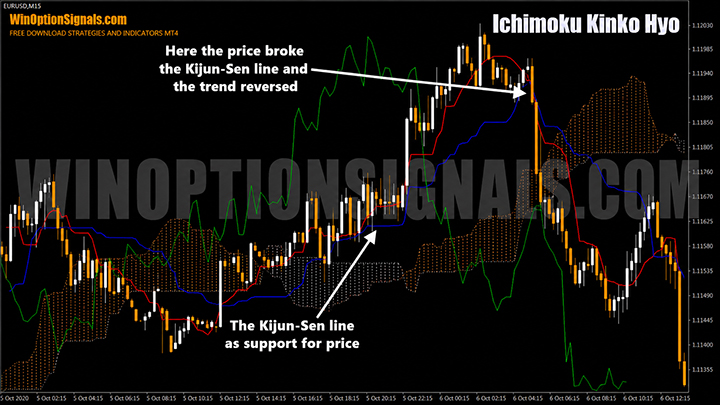
The Kijun-Sen line acts as a support for price movement. It effectively "anchors" the prevailing price direction — if price breaks through the Kijun-Sen, this is considered a strong signal of a directional change. A price bounce off the Kijun-Sen level provides a good opportunity to add to a position in the direction of the established move:
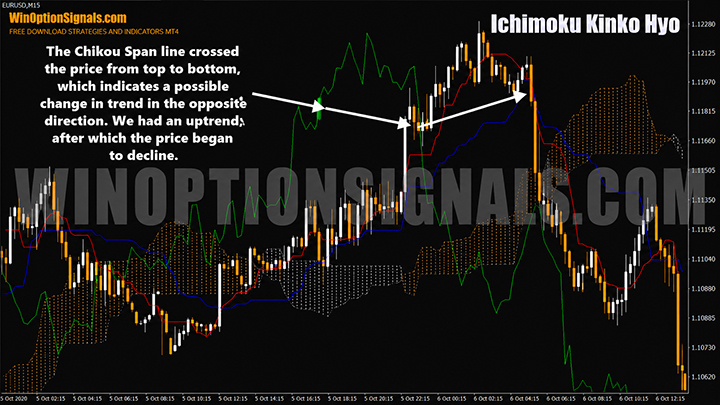
The Chikou Span line acts as a leading indicator, providing early warning of potential price changes. The key scenario to watch for is when this line crosses the price: a cross from top to bottom may indicate accumulation ahead of a downward trend, while a cross from bottom to top suggests a possible upward move:
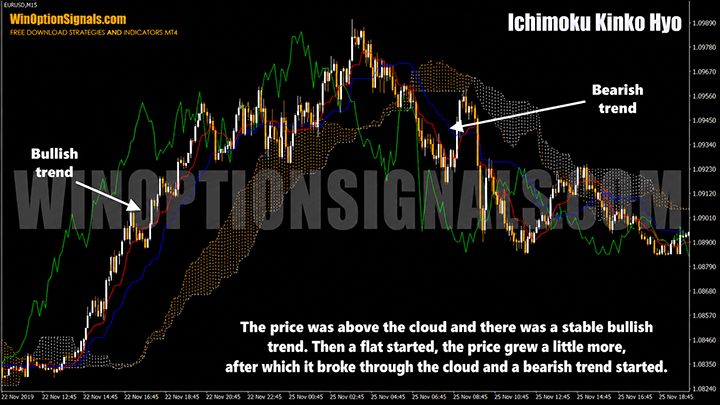
The Senkou Span A and Senkou Span B lines form what is widely considered the centerpiece of the Ichimoku Kinko Hyo indicator. Together they are known as Kumo, or the cloud — visually represented as the shaded area on the chart between the two lines.
The cloud provides the following analytical signals:
- Price trading above the cloud signals a sustained bullish trend.
- Price trading below the cloud signals a sustained bearish trend.
- Price trading within the cloud signals a weak, consolidating market.
Ichimoku Indicator: Recommendations Before Trading
In binary options trading, the Ichimoku Cloud indicator is widely used to identify significant support and resistance levels. The Senkou Span A and Senkou Span B lines act as firm boundaries for correlated price movement.
The Ichimoku indicator generates reliable signals when the trader understands how to work with trends. Many traders use it as their primary — or even sole — analysis tool, as its calculations remain effective across all phases of a trend.
The Ichimoku Kinko Hyo indicator is available in the MetaTrader 4 terminal, on the TradingView platform, in most binary options broker terminals, and on the live binary options chart on our website:
Binary options brokers that definitely include the Ichimoku Kinko Hyo indicator are Pocket Option and Quotex.
Having studied the material above, you should now have a working understanding of how to apply the Ichimoku indicator in a binary options strategy. If any aspects are still unclear, we recommend studying the indicator's behavior on historical charts before reading further — comparing its performance on historical data with the live examples below will reinforce your understanding.
Next, we look at several practical examples of using the Ichimoku indicator in binary options trading, using the MetaTrader 4 terminal and the Pocket Option broker platform.
Ichimoku Indicator: How to Use in Binary Options Trading
Let's first cover some general trading guidelines for the Ichimoku indicator before moving on to specific strategies and trade examples.
The Ichimoku Kinko Hyo indicator creates support and resistance zones formed by the Tenkan-Sen and Kijun-Sen lines.
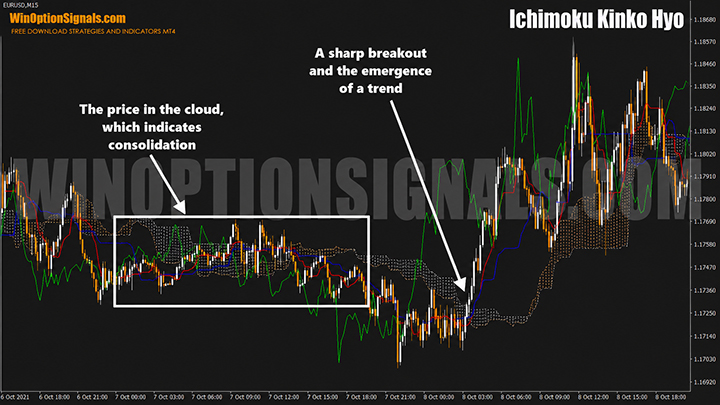
When price is inside the cloud, this indicates consolidation. During trendless periods, it is advisable to avoid opening trades, as price direction becomes difficult to predict.
A breakout of the cloud signals a change in trend direction and warrants considering options in the direction of the breakout.
Ichimoku Indicator: Strategy on the Pocket Option Platform
Ichimoku Kinko Hyo can be used as a strategy indicator even on short timeframes. Although the original author recommended using it on medium-term timeframes, modern traders have adapted it for intraday trading on M1 and M5 charts.
This example uses the Pocket Option platform. Add the Ichimoku Kinko Hyo indicator from the indicator panel and apply it to the working chart:
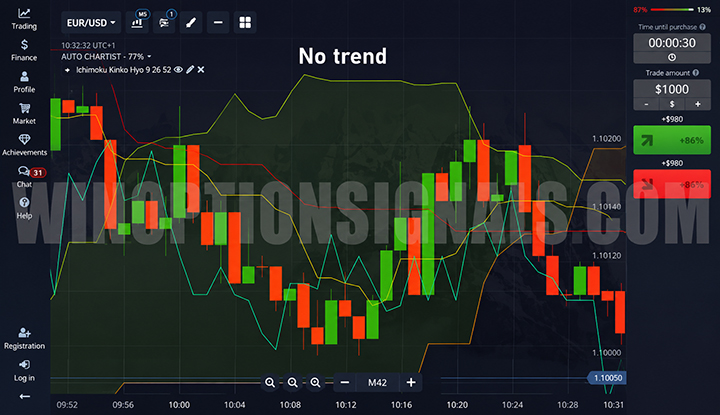
The primary focus should be the price position relative to the Ichimoku cloud. When price is distributed within the cloud, this indicates consolidation:
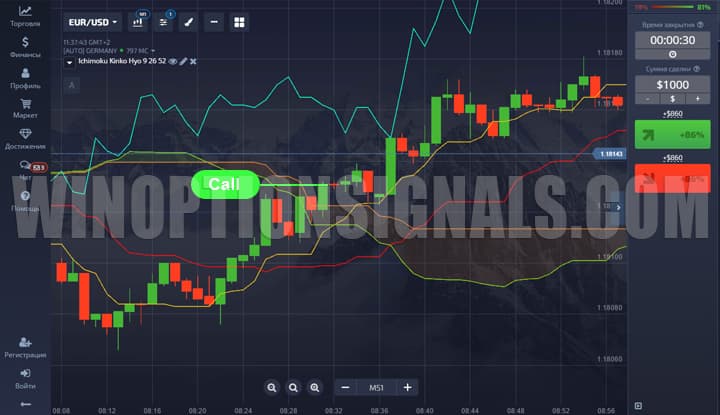
A breakout of the cloud is a strong signal of a new trend emerging, which should be confirmed by a crossover of the Tenkan-Sen and Kijun-Sen lines.
Call option entry conditions:
- The fast line (Tenkan-Sen) crosses above the slow line (Kijun-Sen) below the Ichimoku cloud.
- The trigger candle closes above the cloud.
Put option entry conditions:
- The fast line (Tenkan-Sen) crosses below the slow line (Kijun-Sen) above the Ichimoku cloud.
- The trigger candle closes below the cloud.
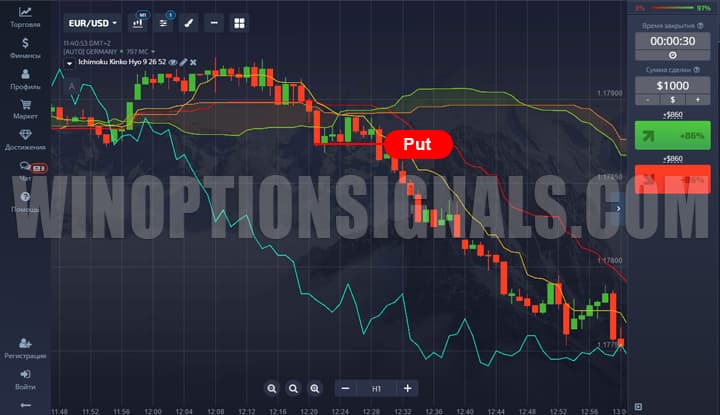
The decisive condition in both cases is the candle closing above or below the cloud. If this condition is not met, the signal is either rejected or interpreted as market weakness — in which case the opposite direction may be more appropriate.
Expiration time should be between 5 and 10 candles, with a maximum of 10 minutes on the M1 timeframe and 50 minutes on M5. By applying these rules and trading with the trend, a win rate of 60% or higher is achievable. Even so, risk must always be managed carefully — the recommended maximum trade size is 5% of the trading account balance.
Ichimoku Indicator and Candlestick Analysis
Let's look at several examples that combine candlestick analysis with the Ichimoku indicator.
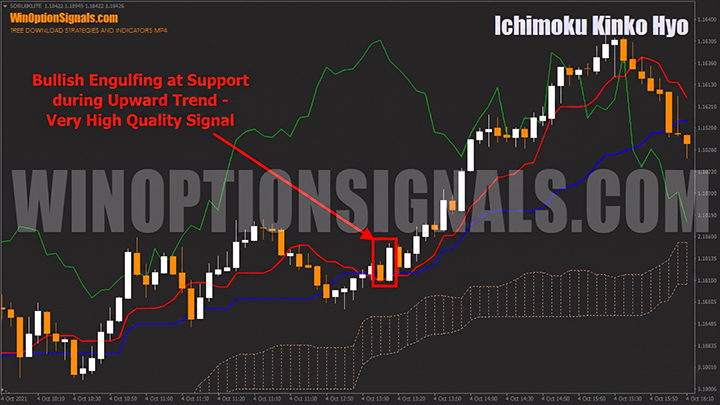
The Engulfing pattern is one of the most widely recognized candlestick formations. It forms when a new candle's body completely encompasses the body of the previous candle — effectively "engulfing" it. This pattern is a strong price reversal signal, and when it appears at support or resistance levels defined by the Ichimoku lines, it provides reliable option entry signals:
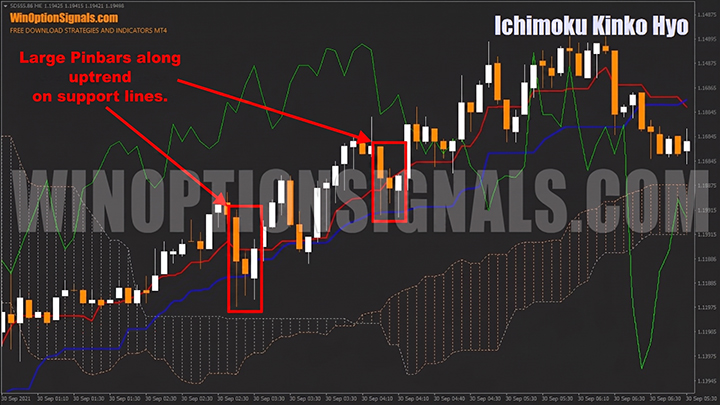
Pin bars — candles with an unusually long shadow — are another powerful candlestick pattern. A long wick typically reflects strong rejection by one side of the market:
- a long upper wick indicates bearish dominance;
- a long lower wick indicates bullish dominance.
Entries taken when a pin bar appears at Ichimoku support or resistance levels tend to have strong accuracy:
Candlestick analysis extends well beyond these two patterns. Any candlestick configuration can be combined with the Ichimoku indicator, and the analysis can be further enhanced with Price Action and graphical analysis techniques.
Conclusion
The Ichimoku indicator is an excellent choice for traders who want a comprehensive, indicator-based approach to binary options trading. It stands apart from most indicators in the depth of its functionality and is well worth mastering to expand your analytical toolkit.
As with any new strategy or indicator, always test it first on a demo account before risking real capital, and consistently apply sound money management and risk management principles. These simple rules significantly reduce risk and lower the probability of depleting your trading account.
If you have not yet chosen a broker, our binary options broker ratings provide a current ranking of leading brokerage services, from which you can select a company suited to your needs.
Download the Ichimoku Indicator for Free
Have questions about how this strategy or indicator works? Leave a comment below, and subscribe to our YouTube channel WinOptionCrypto — we'll answer your questions in upcoming videos.

To leave a comment, you must register or log in to your account.