Divergence is primarily a mathematical concept describing a discrepancy between two values. In financial markets, however, the term is applied specifically to situations where the price movement of an asset diverges from the readings of a technical indicator. Learning to recognise divergence in a timely manner can significantly improve a trader's profitability in both binary options and forex trading.
Definition of the Concept
In the context of binary options trading, divergence refers to a situation where the current price movement and the readings of a technical indicator move in opposite directions. This type of discrepancy can appear with almost any technical analysis tool. Traders who use divergence signals typically rely on the MACD indicator to identify them.
There are two types of divergence: bearish divergence (divergence) and bullish divergence (convergence). Bearish divergence occurs when the price makes a higher high while the indicator makes a lower high. Its appearance signals that a market correction is likely in the near future and the trend is expected to turn downward. On the chart, this is reflected as two local peaks where the first peak on the price chart is below the corresponding peak on the MACD histogram, and the second is above it (Fig. 1).
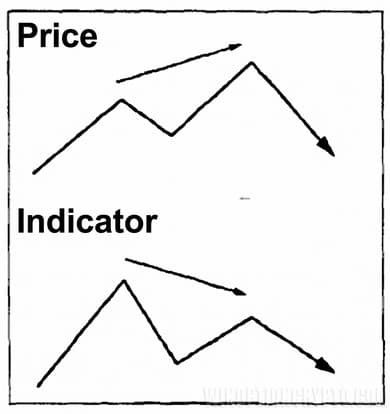
Fig. 1. Divergence between MACD and current price. The first peak on the price chart is below the corresponding peak on the indicator histogram.
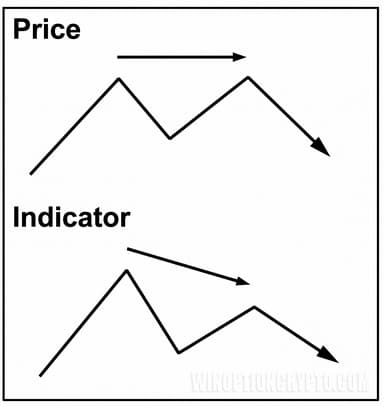
Fig. 2. Divergence between MACD and price, where two peaks at the same level form on the price chart, while on the histogram the first peak is higher than the second.
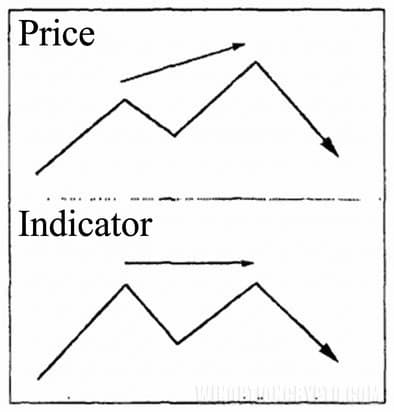
Fig. 3. Divergence between MACD and price, where the histogram peaks are at the same level while the first peak on the price chart is lower than the second.
In all of the cases above, divergence is confirmed whenever a discrepancy exists between the indicator and price dynamics, regardless of the exact positions of the peaks. Each of these examples signals an impending market correction and the beginning of a decline in asset prices.
Convergence describes the opposite situation: two troughs (lows) appear on the price chart that differ in height and slope from the corresponding troughs on the MACD histogram.
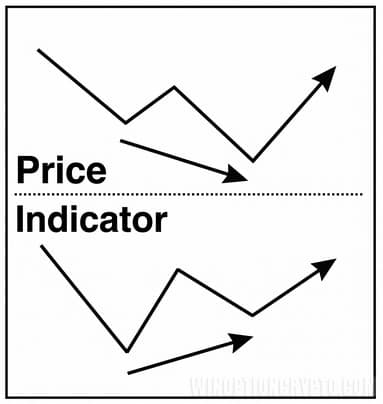
Fig. 1. Convergence between price and indicator, where the first trough on the price chart is above the second, while the opposite pattern has formed on the MACD histogram.
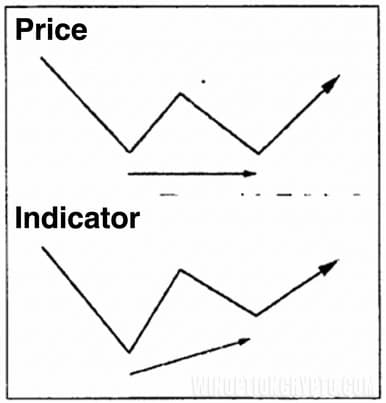
Fig. 2. Convergence where both troughs on the price chart are at the same level, while the troughs on the indicator histogram are at different levels.
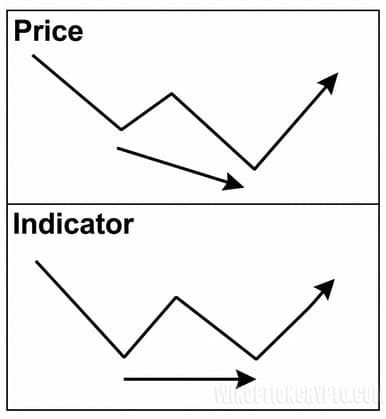
Fig. 3. Convergence where the troughs on the indicator histogram are at the same level, while the troughs on the price chart are at different levels.
The appearance of convergence (bullish divergence) signals an impending trend reversal and the beginning of an upward move in asset prices. These are the signals that are most useful when trading binary options.
According to trading practice, these signals prove accurate in approximately 80% of cases. This means that a trader who learns to identify divergence and convergence reliably can expect to close up to 80% of trades profitably.
Indicators for Identifying Divergence
Divergence can be identified either manually or with the help of specialised indicators. Manual identification requires constant chart analysis and close attention to discrepancies between price dynamics and MACD. Using dedicated indicators is more practical, as it saves time and ensures that divergences are not missed.
Traders commonly use the following indicators for this purpose:
- MACD Divergence indicator for binary options;
- Divergence Petr indicator for binary options.
(Download links and archives for both indicators are available at the end of this article.)
Instructions for installing indicators in MetaTrader 4:
The MACD Divergence indicator works on the same principle as the standard MACD and is included in the default MT4 package. Its key advantage over the basic tool is that it automatically detects divergences on the chart.
The indicator signals divergence in the following ways:
- sloping lines are drawn on the price chart between the local highs and lows;
- sloping lines are overlaid on the MACD Divergence histogram between the corresponding extremes;
- arrows appear on both charts indicating the recommended trade direction (up for buy, down for sell).
In practice, traders who use MACD Divergence do not need to search for discrepancies manually. Instead, they respond directly to the indicator's signals by buying Call options on convergence signals and Put options on divergence signals.
Example of a Convergence Signal
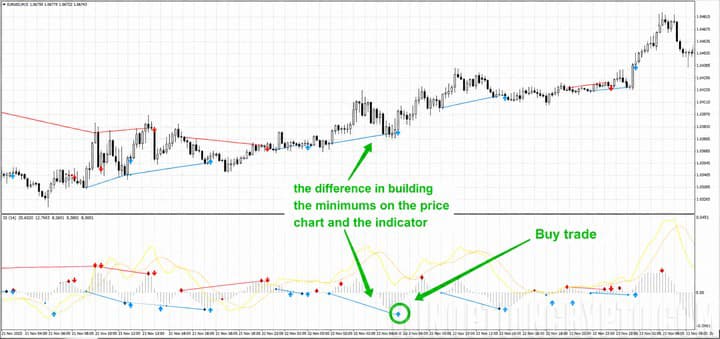
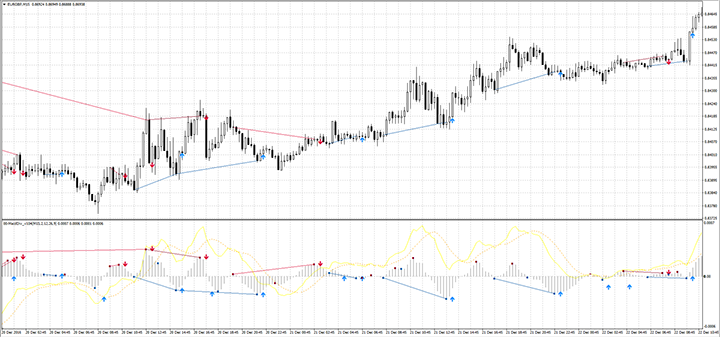
The indicator identified the point where the price chart and MACD histogram diverge, and marked the direction in which the trend is changing.
Example of a Divergence Signal
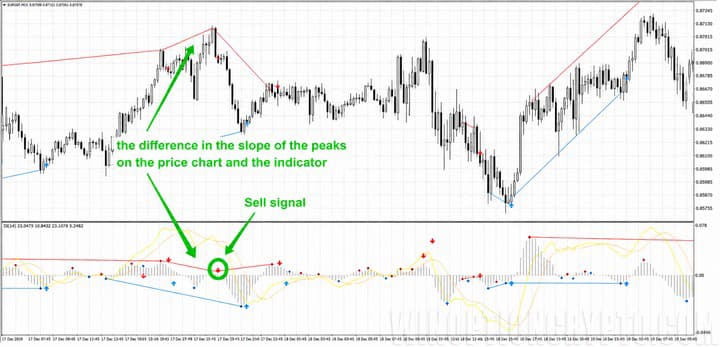
The indicator marked the peaks on both the price chart and the MACD histogram, and used an arrow to indicate the direction of the expected trend change.
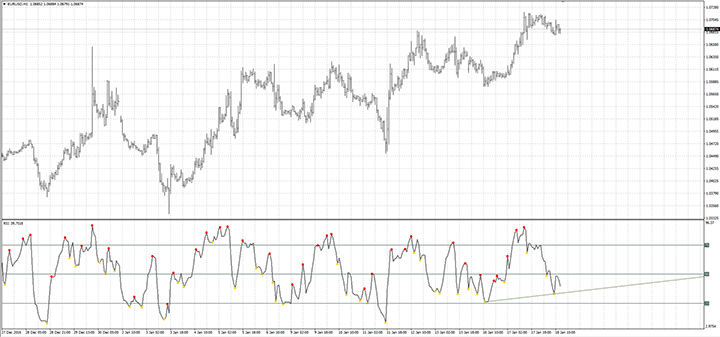
In addition to MACD Divergence, the Divergence Petr indicator can also be used to identify divergence. This tool works on a similar principle, with the key difference being that Divergence Petr measures the discrepancy between the price chart and the RSI indicator.
The chart below shows a situation where an upward price reversal is developing: the first price low is below the second, while on the RSI the opposite is true — the second low is lower. A buy order should be placed when the second low forms.
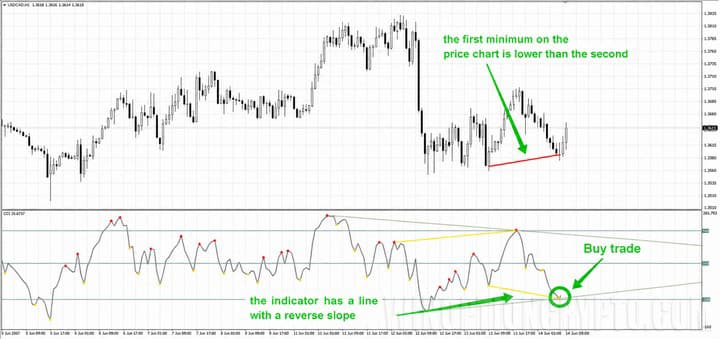
Example of a Divergence Signal on a Chart
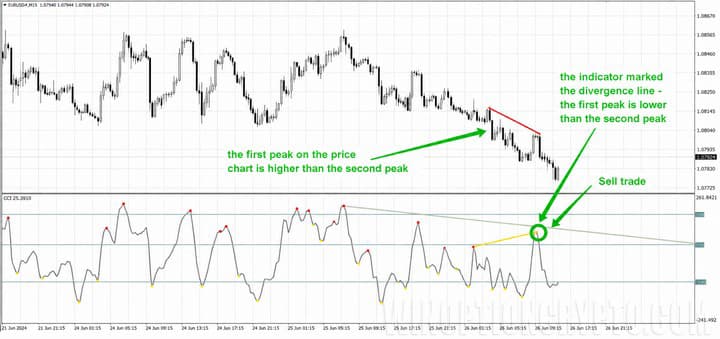
On the price chart, the first peak is significantly higher than the second, while on the RSI the second peak is higher. This indicates a downward reversal in price. A sell order is recommended when the second peak forms.
Divergence indicators are highly effective in binary options trading. In practice, the signals they generate tend to provide some of the most reliable reversal signals available, enabling traders to open more profitable trades on the broker's platform.
Download the MACD Divergence Indicator
Download the Divergence Petr Indicator
Not sure how this strategy or indicator works? Leave a comment below, and subscribe to our YouTube channel WinOptionCrypto — we'll answer your questions in upcoming videos.
See Also:
- Binary options broker bonuses
- Accurate arrow indicators for binary options
- Top 5 Mistakes of Binary Options Traders
- How to make money on binary options
- Best Non-Repainting Indicators for Binary Options
To leave a comment, you must register or log in to your account.