The Bollinger Bands indicator is one of the most widely used indicators in the world. Developed in 1987 by investor and analyst John Bollinger, it has helped countless traders improve their results and remains in active use across both exchange trading and binary options markets.
One of its key advantages is that it is included as a standard indicator on virtually all major platforms and trading terminals, and it works across cryptocurrencies, currency pairs, stocks, and other trading instruments. This means you can use it in MetaTrader 4 and 5 as well as on live binary options charts.
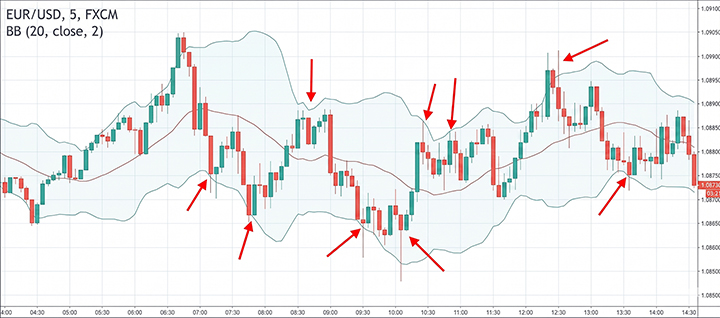
Here is how the indicator looks on a chart:
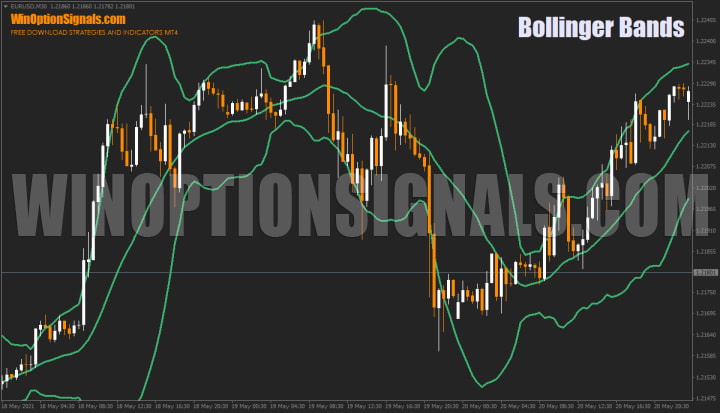
Bollinger Bands — Indicator Description
On the chart, Bollinger Bands appear as two curved lines that define the upper and lower boundaries of a price channel. These lines can be thought of as dynamic support and resistance levels, and in most market conditions they sit at a meaningful distance from the current price.
Bollinger Bands (BB) are similar in appearance to another indicator — the Envelopes (Moving Average Envelope):
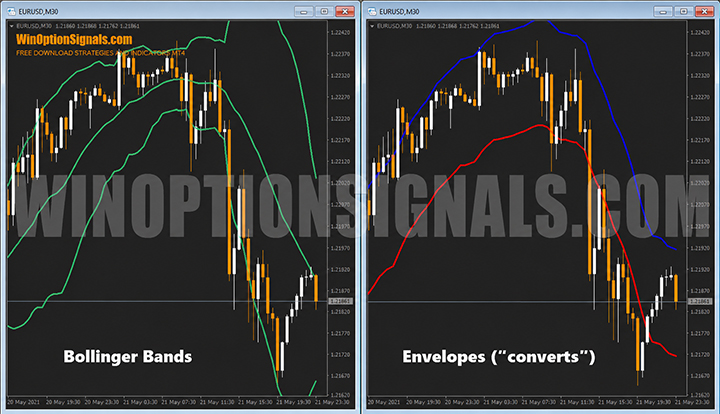
The difference is that Envelopes place their outer lines at a fixed percentage distance from the Moving Average (MA), whereas Bollinger Bands use standard deviations — a value that changes with market volatility. As a result, BB narrows during low-volatility periods and widens when price movement intensifies.
The underlying principle of Bollinger Bands is that approximately 5% of price movements should fall outside the band boundaries, with 95% remaining within the channel. The indicator consists of three lines: a central Moving Average, an upper band (the MA plus a set number of standard deviations, typically 2), and a lower band (the MA minus the same deviation).
The key feature of the BB channel is that its width adapts to market conditions. The band width is directly proportional to the standard deviation of price from the MA over the look-back period. When volatility increases — for example, following a major economic news release — the bands expand. In calmer markets, they contract.
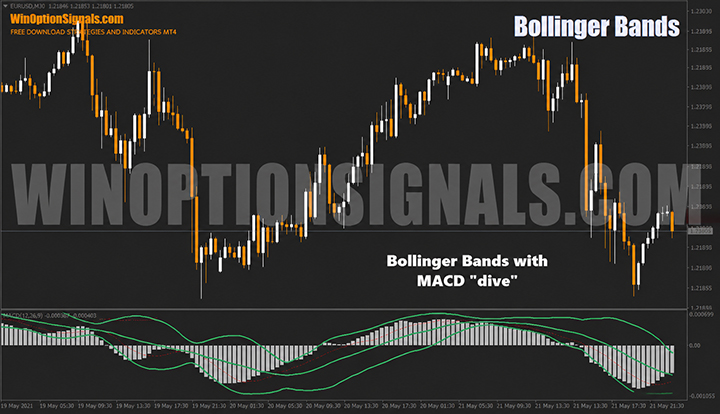
When using Bollinger Bands in binary options, we recommend combining them with other indicators. The primary value of BB lies in identifying rapid deviations from the average price within a trend. With the right settings, the MA line becomes an effective support or resistance level, and the outer bands serve as price targets when opening trades. While BB is most commonly applied directly to the price chart, it can also be combined with an oscillator displayed in a separate subwindow:
Bollinger Bands track the range within which price is developing. When the bands point in one direction, price tends to continue in that direction until it encounters significant opposing pressure. The area just beyond the upper or lower band represents a zone of uncertainty.
A ranging (flat) market persists until the BB lines begin to diverge, signalling that the consolidation has ended and a directional move is underway. Price can then trend dynamically along the band boundary in the direction of the prevailing trend. It is worth remembering that the final direction of any trend is influenced by all relevant support and resistance levels — not only those indicated by BB.
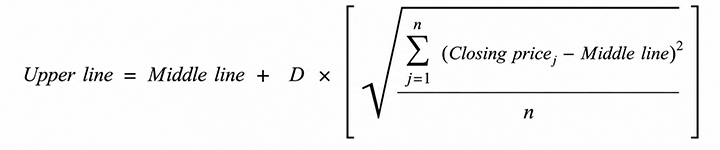
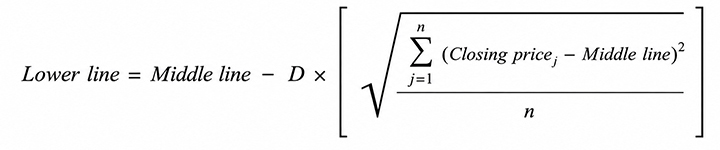
Bollinger Bands — Formula and Calculation
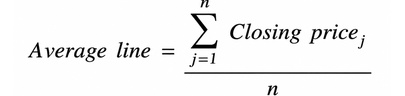
Bollinger Bands consist of three lines. The centre line is a standard Moving Average, where n is the number of time periods over which the MA is calculated:
The upper band is the MA shifted upward by a fixed number of standard deviations (denoted as "D" in the formula below, typically set to 2):
The lower band is the MA shifted downward by the same number of standard deviations (D):
John Bollinger himself recommends using a 20-period simple Moving Average for the centre line and setting the outer bands at 2 standard deviations. He also cautions that Moving Average readings based on fewer than 10 time periods are unreliable.
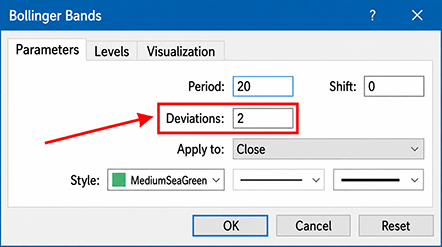
Bollinger Bands Settings
Based on the operating principles described above, you can adjust the deviation value in the indicator settings:
With default settings, price will remain within the channel approximately 95% of the time. When the bands begin to widen, this signals a developing trend; when they narrow, it indicates a ranging (flat) market.
The settings panel includes the following parameters:
- Period. The recommended period for Bollinger Bands is 13–24 (20 is the most widely used), and the deviation is typically set to 2–5 (with 2 or 3 being optimal). You can also experiment with Fibonacci numbers, the number of trading days in a year (240), or round values between 50 and 200. Keep in mind that the longer the period, the lower the indicator's sensitivity. In a calm market, an excessively long period will reduce BB's usefulness for binary options trading. Under normal conditions, price moves within the bands the vast majority of the time — breaking beyond the outer bands on strong impulses is normal. If price breaks out of the bands very frequently, consider increasing the period. If price rarely touches the outer bands, consider reducing it;
- Shift. Moves the indicator forward or backward along the chart by a set number of candles;
- Apply to (Price). Closing prices are most commonly used for the BB calculation. Other options — such as typical price or weighted close — can also be tested.
Bollinger Bands work across all timeframes, though they are most frequently used for intraday short-term trading. Remember that the indicator should be calibrated separately for each asset and timeframe.
Advantages and Limitations of Bollinger Bands
The advantages of Bollinger Bands in binary options strategies come down to two key properties:
- The indicator displays the main trend direction and channel boundaries, combining the functions of a moving average and a price range indicator;
- The band width adapts dynamically as price moves. This combination creates meaningful signals when Japanese candlestick patterns interact with the band boundaries. For example, if a Doji candle — which signals market indecision — forms at the point where the bands are converging, this suggests a likely short-term price reversal. BB responds to price dynamics with characteristic expansions and contractions, giving the trader a sense of how far an impulse is likely to carry before the opposing force pushes price back toward the central MA. The relationship between band direction and width relative to price movement is complex — developing a genuine feel for it requires extended practice. However, the time spent observing the indicator in live market conditions is well worth it.

The main limitation of Bollinger Bands — shared with the simple Moving Average — is lag. The longer the period, the greater the lag.
It is also worth noting that if you are already using Bollinger Bands on a chart, the CCI oscillator becomes redundant and can be removed. Both indicators work on similar principles — measuring deviation from a Moving Average — but Bollinger Bands correlate more naturally with price movement and are easier to read visually.
Binary Options Strategies Using Bollinger Bands
Bollinger Bands underpin a large number of strategies, but rather than listing all of them, here are the four most effective and well-tested approaches:
- Bounces and impulse breakouts of the Bollinger Bands boundaries;
- Candlestick sequence with Bollinger Bands;
- BB Stochastic System;
- SAR BB Envelopes System.
The Envelopes indicator for MetaTrader 4 can be downloaded at the end of this article. All other indicators used are standard tools built into the platform.
Bounces and Impulse Breakouts of the Bollinger Bands Boundaries
As a channel indicator, the most commonly used BB signal is the price bounce from the channel boundary back toward the centre. This approach works particularly well during ranging markets and the Asian trading session. However, since ranging conditions also occur during daytime hours, it is generally better to focus on the more liquid European and American sessions:
As the chart shows, during a flat almost every touch of the channel boundary results in a bounce. This does not happen every single time, but it is a frequent enough occurrence to trade reliably.
This strategy is primarily suited to turbo options with expirations of 1–2 candles on timeframes of 3 minutes or less. Additional filters can be used to improve accuracy, though many indicators will not provide useful readings in this context, since the impulse that follows a boundary touch typically lasts only about a minute — the trade needs to be opened immediately.
A refinement is to wait not just for a touch of the boundary, but for an impulse breakout followed by a candle closing beyond the boundary before entering the trade:
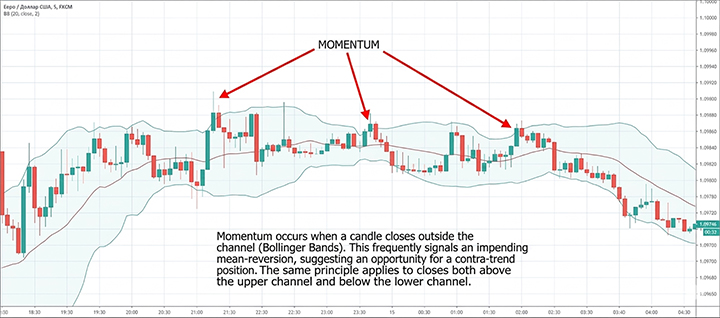
This reduces the number of trades but improves the overall quality of the signals.
Candlestick Sequence with Bollinger Bands
This is the most research-intensive approach, as it requires building statistics for each asset you plan to trade. The premise is that after a specific number of consecutive candles closing above or below the channel boundary, a pullback occurs. If this pattern holds 80% or more of the time on historical data, it can be traded systematically. The chart below shows an example using a 4-candle sequence:
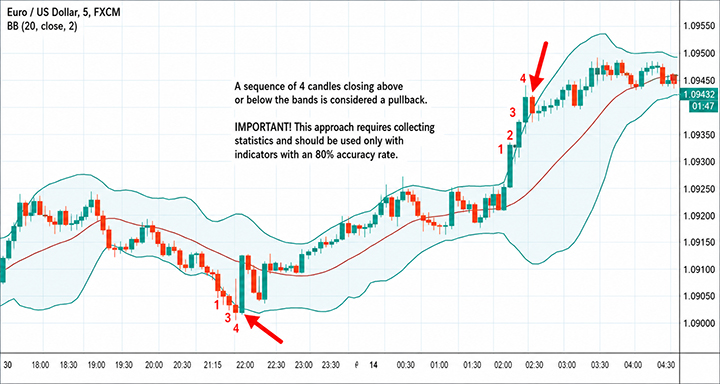
This example is for illustration only. The 4-candle sequence should not be applied without first conducting your own analysis on the asset and timeframe you intend to trade — there is no universal rule here.
BB Stochastic System
As the name suggests, this approach combines Bollinger Bands with the Stochastic Oscillator, which serves as a confirmation filter for both bounces and breakouts from the channel boundary.
The rule is straightforward: when price breaks through or approaches a BB boundary, the Stochastic should be below 20 (for a potential bounce from the lower band) or above 80 (for a potential bounce from the upper band):
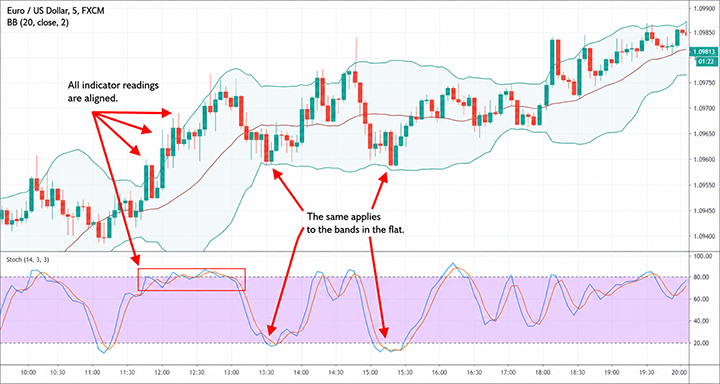
This provides additional confirmation in both ranging and trending conditions. Fine-tuning the settings of both indicators for your chosen instrument can improve signal quality further.
SAR BB Envelopes System
This strategy was originally developed for Forex on higher timeframes, but has been adapted for binary options with an expiration of 3 candles, applicable on any chart period. While it can be used on M1, it performs best on higher timeframes.
The core idea is to enter a position when price breaks out of a narrow ranging period. Three indicators are used to identify the breakout:
- Bollinger Bands
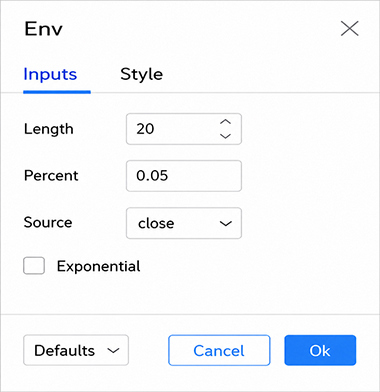
- Envelopes
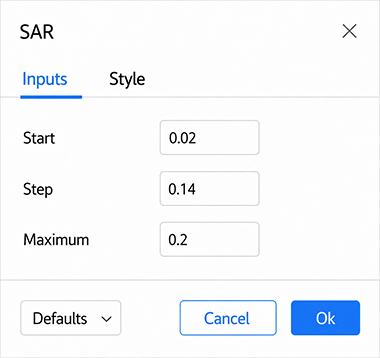
- Parabolic SAR
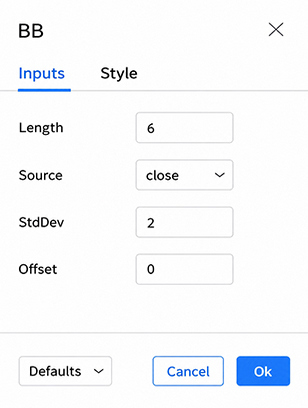
Non-default settings are required for all three:
| Bollinger Bands Settings | Parabolic SAR Settings | Envelopes Settings |
|
|
|
|
The setup requires identifying a narrow consolidation phase — signalled when the Bollinger Bands are contained within the Envelopes channel. Once price breaks out of this range, an option can be opened immediately in the breakout direction. The Parabolic SAR should be positioned above or below price, depending on which direction the breakout occurred:
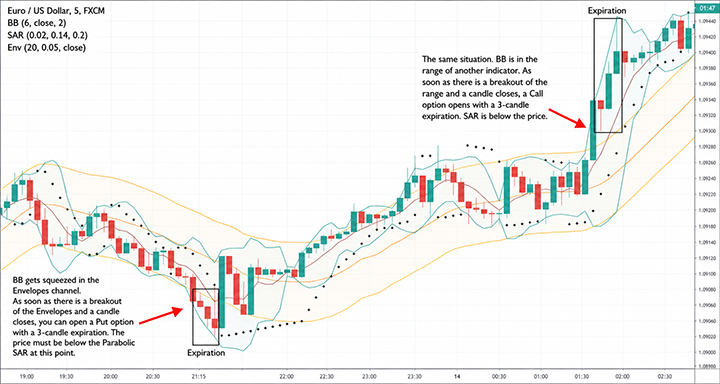
This strategy produces its best results on H1 and higher timeframes. It can be applied to shorter periods, but the risk increases — the smaller the timeframe, the higher the market noise and the greater the likelihood of false signals.
Conclusion
Many more Bollinger Bands-based binary options strategies can be found online, but most of them are variations on the four approaches covered above.
Strategy alone is not the only component of successful trading. Sound money management and working with a reliable broker are equally important. You can find vetted broker options in our binary options broker rankings.
Always test any trading system on a demo account before going live.
Download the Envelopes Indicator
Not sure how a particular strategy or indicator works? Leave a comment below, and subscribe to our YouTube channel WinOptionCrypto — we'll answer your questions in upcoming videos.

To leave a comment, you must register or log in to your account.