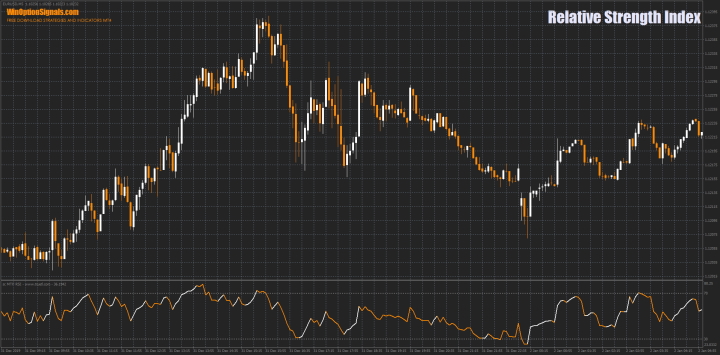
The Relative Strength Index (RSI) was created by J. Wells Wilder in 1978. This oscillator-type indicator measures the speed and magnitude of price fluctuations on a scale from 0 to 100. As Wilder defined it, the indicator is considered overbought when its line is above 70 and oversold when it falls below 30. The RSI also generates other types of signals, which are covered below. In addition, it can be used to identify the prevailing trend.
The RSI is widely used among binary options traders who focus on momentum-based price movements. It is also frequently referenced in trading literature — for example, Constance Brown's book Technical Analysis for the Trading Professional introduces the concept of bull and bear market ranges for the RSI.
Despite being developed before the era of personal computers, the Relative Strength Index remains one of the most widely used indicators among active traders today.
Formula for Calculating the RSI Indicator
The indicator is calculated using the following formula:

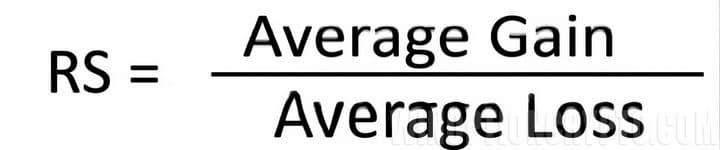
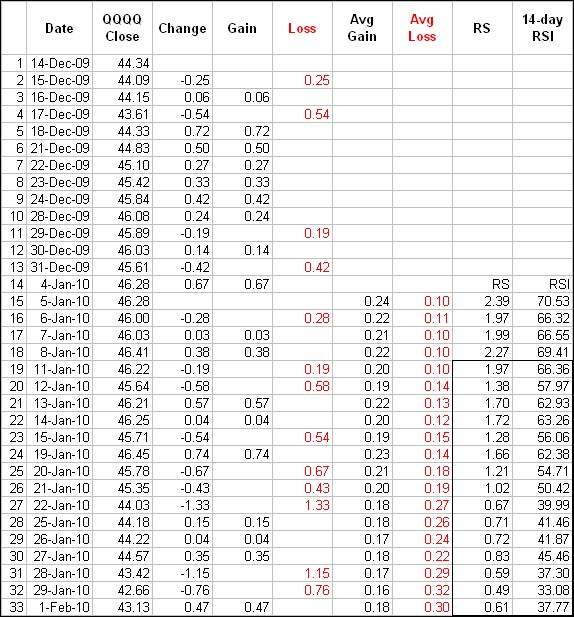
To make the formula more accessible, the indicator is broken down into its components: RS, average price gain, and average price loss. The calculation uses a period of 14, which is the default value recommended by the indicator's author. Price losses are used in the formula as positive values.
The first calculations for average gains and losses are simple averages over the most recent 14 periods:
- First average gain = total gains over the last 14 periods / 14.
- First average loss = total losses over the last 14 periods / 14.
All subsequent calculations incorporate the previous average and the most recent gain or loss:
- Average gain = [(previous average gain) × 13 + current gain] / 14.
- Average loss = [(previous average loss) × 13 + current loss] / 14.
This method of combining previous and current values is known as smoothing — the same technique used in moving averages. As a result, the longer the calculation period, the smoother and more stable the indicator becomes.
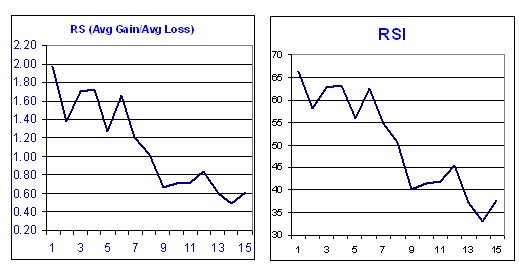
Wilder's formula converts the RS ratio into an oscillator with a fixed range of 0 to 100. The RS chart closely resembles the RSI chart; the normalisation step simply makes it easier to identify extreme readings. When the average gain is 0, the RSI value is also 0 — using a period of 14, this means prices declined in all 14 periods with no gains to measure. Conversely, the RSI reads 100 when the average loss is 0, meaning prices rose in all 14 periods with no declines to measure.
The following example illustrates the indicator's calculation in practice:
The smoothing process has a direct effect on RSI values. After the initial calculation, RS values are smoothed on each subsequent bar by multiplying the previous value by 13, adding the most recent value, and dividing by 14. This applies to both average gains and average losses. Because of this smoothing, RSI values will vary depending on the total length of the data series used: a 250-period dataset produces more smoothing than a 30-period dataset, which has a modest effect on the resulting RSI values.
Key Features of the Relative Strength Index Indicator
- Terminal: MetaTrader 4.
- Time frame: M1 and above.
- Expiration: 1 minute and above.
- Types of options: Call/Put.
- Indicators: Relative Strength Index.
- Trading instruments: Any.
- Trading hours: 08:00–21:00 UTC.
- Recommended brokers: PocketOption.
Installing the Relative Strength Index Binary Options Indicator
The default period for the RSI indicator is 14. Reducing the period increases sensitivity, while increasing it reduces sensitivity. With a period of 10, the indicator will reach the 30 or 70 levels more quickly than with a period of 20. The volatility of the traded asset also affects the indicator's behaviour.
A reading above 70 places the indicator in the overbought zone; a reading below 30 places it in the oversold zone. These are the standard level values, but they can be adjusted for more precise signals. Using levels of 20 and 80 will produce significantly fewer signals, which may suit more conservative traders. Short-term traders may prefer a period of 2, looking for overbought readings above 80 and oversold readings below 20.
The RSI is a built-in indicator in the MetaTrader 4 terminal and requires no download to use.
To avoid configuring the chart manually, a ready-to-use indicator file and template are available for download at the end of this article.
Instructions for installing indicators in MetaTrader 4:
Examples of Trading Using the RSI Indicator
The RSI generates several types of signals. The most commonly used are:
- Overbought and oversold zones.
- Divergences.
- Trend identification.
The RSI is a versatile indicator that can be applied to any time frame and asset class, so settings should be chosen to match your trading style. The examples below use the EUR/USD currency pair for intraday trading on the M5 chart with a 15-minute expiration time.
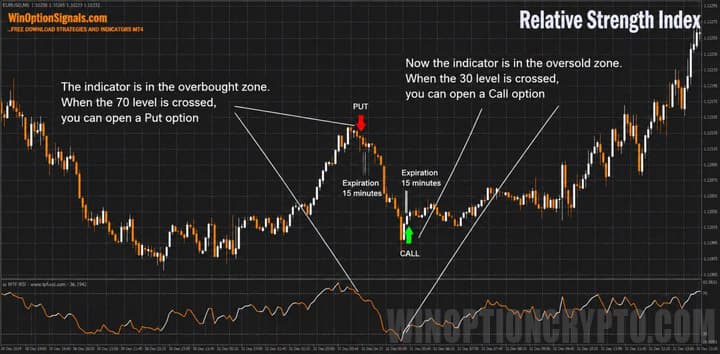
Overbought and Oversold Zones of the RSI Indicator
Levels 30 and 70 were defined by the indicator's author and remain the standard reference levels today. The examples below show that despite the passage of time, these levels continue to produce reliable signals and do not generally need to be adjusted.
Opening Call and Put Options
Like most momentum oscillators, the RSI's overbought and oversold levels work best when the price is moving within a range. In this example the range is not perfectly defined, but prices are nonetheless moving within identifiable boundaries.
Indicator Divergences
According to Wilder, divergences signal a possible reversal because directional momentum fails to confirm the price movement.
The articles on the Power Fuse binary options indicator and the MACD divergence indicator explain how divergences work in greater detail. All of the principles described there apply equally to the RSI.
Opening Call and Put Options
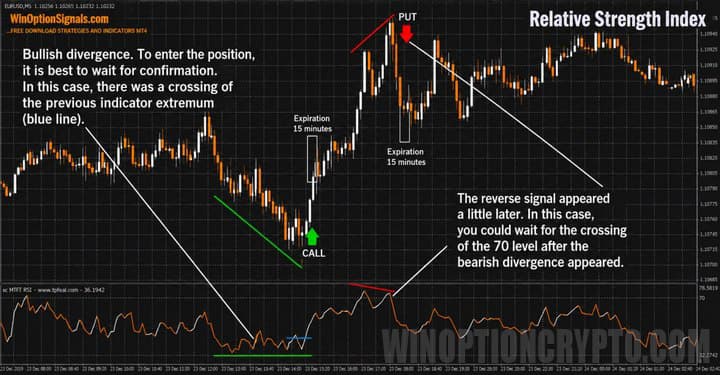
It is worth noting that divergences should not be over-relied upon. During a strong trend, multiple bearish divergences can appear before any reversal actually occurs — and the same applies in a strong downtrend.
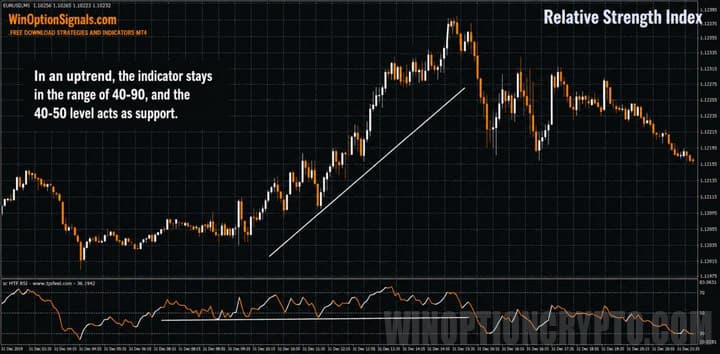
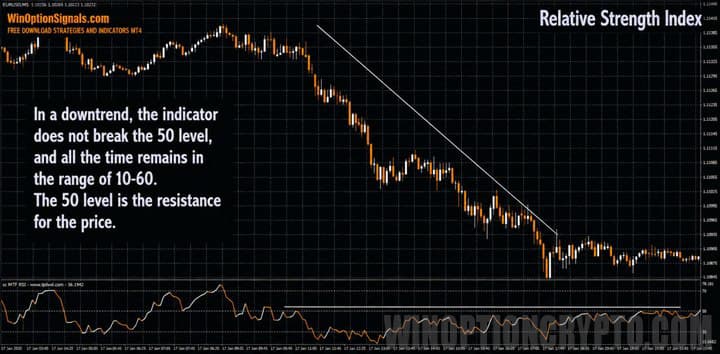
Trend Identification Using the RSI Indicator
There is a widely observed tendency for the RSI not to use its full 0–100 range. In a bull market (uptrend), the RSI tends to oscillate between 40 and 90, with the 40–50 zone acting as support. In a bear market (downtrend), it tends to oscillate between 10 and 60, with the 50–60 zone acting as resistance. These ranges will vary depending on the RSI settings, trend strength, and asset volatility.
It is important to note that this type of analysis does not generate trade entry points — it simply helps confirm which trend is currently prevailing in the market.
Uptrend
Downtrend
Conclusion
The RSI has consistently produced reliable results over many decades. Its main strengths are its versatility — it can be applied to any asset and time frame — and its ability to help identify the prevailing market trend.
Regardless of the settings you choose for the RSI, always test the indicator on a demo account before using it with real funds. If you are unsure which broker to use, our binary options broker rating can help you find a suitable option.
Download Template and Indicator: Relative Strength Index (RSI)
Not sure how this indicator works? Leave a comment below, and subscribe to our YouTube channel WinOptionCrypto — we'll answer your questions in upcoming videos.

To leave a comment, you must register or log in to your account.