The CCI indicator has been used for several years to predict price movements in financial markets. More recently, it has also been adopted for binary options trading. CCI stands for Commodity Channel Index — an oscillator that helps identify points at which the price is likely to reverse direction.
Features of CCI in Relation to Binary Options
Financial markets are characterized by changing price directions: upward movement, downward movement, and ranging conditions (where the chart moves sideways). The classic trading approach involves placing orders in the direction of the prevailing trend — for example, opening a buy trade when the trend is moving upward. The earlier a trader enters the market in such situations, the greater the potential profit, provided the position is closed at the right time.
The main challenge of trading in financial markets is that it is nearly impossible to predict exactly when a new trend will begin or end. Indicators can help to some extent, but technical tools do not always produce accurate forecasts. Oscillators, however, offer certain advantages in this regard. CCI is one of the tools capable of identifying trend reversal points.
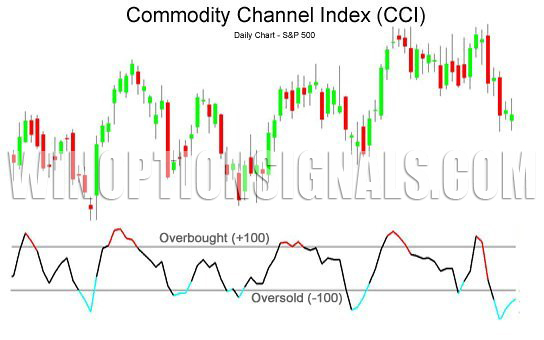
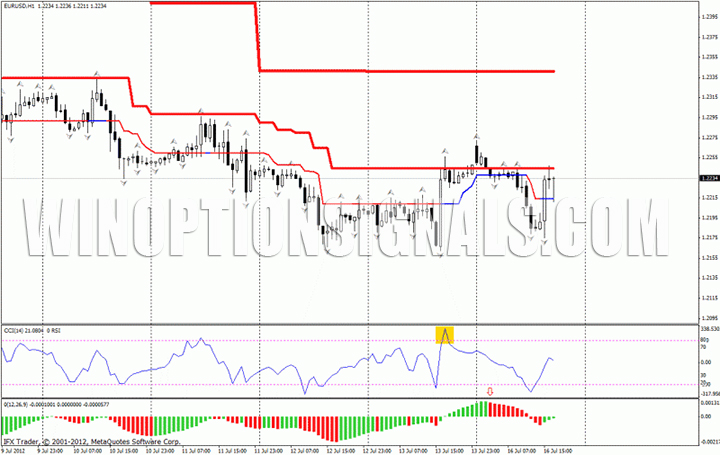
The chart above shows the oscillator line moving between the -100 and +100 levels (the oversold and overbought levels, respectively). It remains within this range approximately 75% of the time. The primary adjustable parameter of the CCI oscillator is the number of calculation periods. The indicator's developer, D. Lambert, recommends setting this value to one-third of the market cycle. For example, if a trader needs analysis covering the past month, this parameter should be set to 10 days.
Lambert also noted that exceeding the recommended value — for instance, using 13 days instead of 10 — causes the oscillator to generate fewer trading signals. Reducing the value below the recommended level increases the number of inaccurate signals. These are general guidelines, intended primarily for traders new to binary options.
An Example of How the CCI Indicator Works
To illustrate how the indicator works, we will look at signals generated for the USD/CAD currency pair.
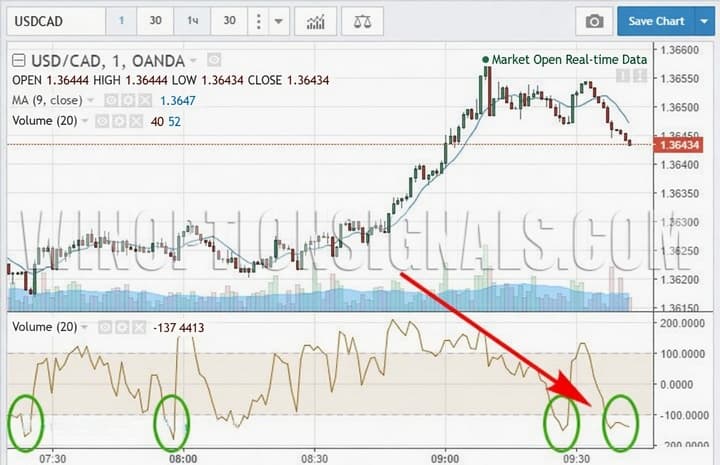
The chart shows that after the oscillator line drops below -100, it quickly reverses and begins moving upward. This signal indicates that the price is likely to change direction soon as well. When this situation arises, it is advisable to place a buy order on a binary option for the USD/CAD currency pair with an expiration time of 15 minutes or less.
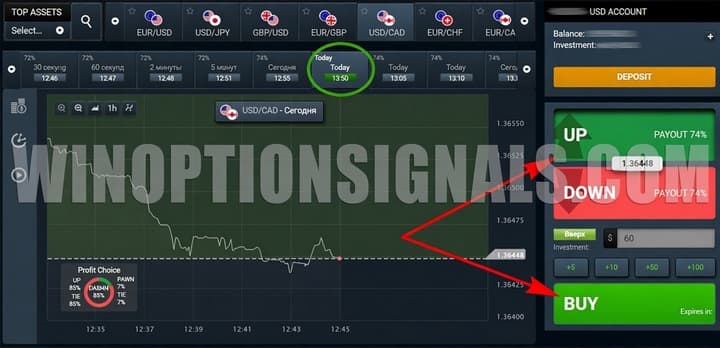
This example shows that if the price rises by even a single point, the payout is 74% of the initial investment.

Binary Options Strategies Using an Oscillator
CCI can be used independently of other technical tools. However, combining it with additional indicators is generally recommended, as this approach reduces the likelihood of false signals. CCI is commonly used alongside MACD, Stochastic, or Bollinger Bands.
The principles underlying this oscillator are incorporated into several other technical analysis tools. This is largely because CCI is capable of generating leading signals, which improves the chances of profiting from binary options trading. The indicator can also be applied within a wide range of strategies.
Instructions for installing indicators in MetaTrader 4:
CCI Signals in Binary Options Trading
CCI provides two types of trading signals. The first occurs when the price crosses the overbought or oversold levels. The second is associated with divergence — a discrepancy between the indicator's readings and the current price movement.
When the oscillator line crosses above the +100 level (the overbought zone), this indicates bullish market sentiment, with most traders placing buy orders on the currency pair. When the CCI line falls below -100 (the oversold zone), this points to a downward trend.
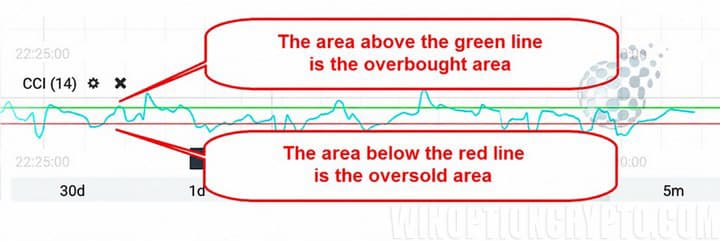
Breakouts through these levels occur relatively infrequently. The oscillator line moves below or above the oversold or overbought thresholds for approximately 25–30% of trading time. However, this is precisely the period considered most favorable for entering binary options trades.
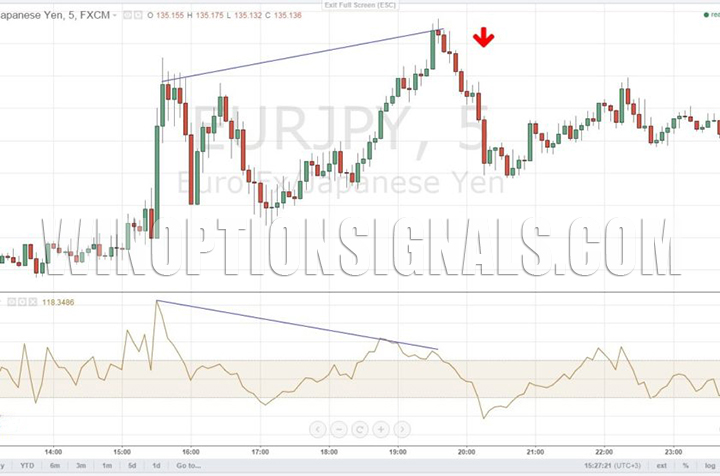
Divergence also presents good trading opportunities. If the indicator line moves downward while the price chart continues in its previous direction, this signals an impending shift to a downtrend.
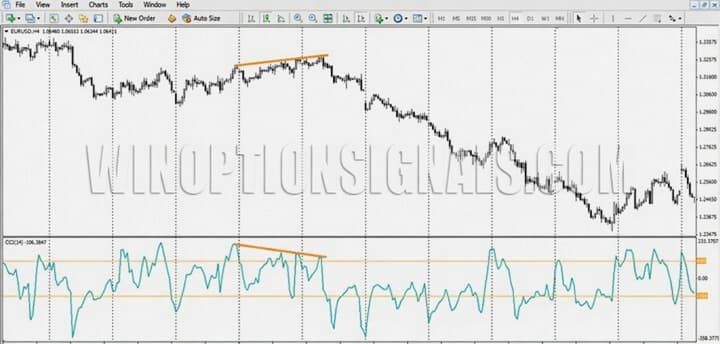
The reverse situation is also possible: the oscillator points upward while the asset's price continues to fall. Divergence is considered a strong signal that should not be overlooked.
Divergence
When the indicator line begins moving upward while the price chart continues to fall, this is a signal to place a buy order. These conditions suggest the downtrend is temporary — the price is continuing lower by momentum, and a reversal should be expected soon.
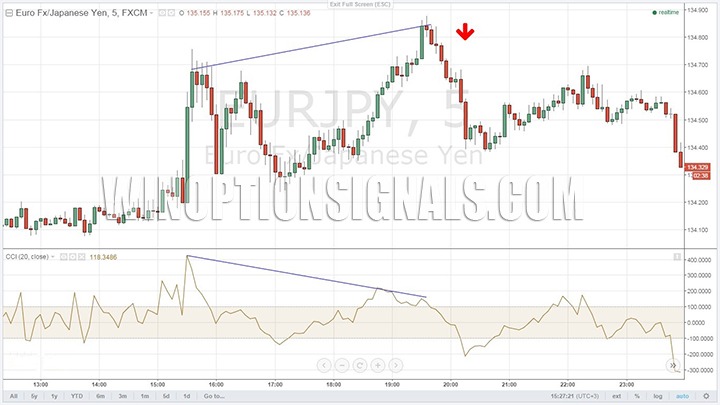
The same logic applies during an uptrend. If the oscillator line moves downward while the asset price continues to rise, a sell order on binary options is recommended.
Summary
One important characteristic of the CCI oscillator is that its effectiveness depends on the cyclical behavior of the selected asset. For this reason, beginners are advised to use the indicator when trading stocks or exchange-traded assets. When applied to binary options, CCI's effectiveness is somewhat reduced. Improving signal accuracy in the Forex market requires fine-tuning the indicator, which is better suited to more experienced traders.
Using CCI alongside other technical analysis tools is strongly recommended — particularly when trading binary options.
A modified version of the CCI indicator is available for download in the archive below. It displays the overbought and oversold zones of an asset more clearly than the standard version.
Download the CCI Indicator
You may also find these indicators useful: RSI Indicator, Stochastic Indicator.
Not sure how this indicator works? Leave a comment below, and subscribe to our YouTube channel WinOptionCrypto — we'll answer your questions in upcoming videos.

To leave a comment, you must register or log in to your account.