The Japanese Candlestick Method
 In the early eighteenth century, Japan used the "candlestick method" to predict rice prices. The system was developed by a family of rice traders. Over time, its creator rose to the position of adviser to the emperor and left behind a highly effective trading system for future generations. The concept later fell out of use, but was eventually rediscovered and applied to stock and currency market analysis. Around forty years ago, the Japanese candlestick method gained recognition as a technical analysis tool. It is similar to a bar chart, but considerably easier to read — and is arguably the most visually intuitive method of technical forecasting in existence. On a chart, the patterns resemble a row of candles arranged on a flat surface, varying in size, with or without wicks.
To build a candlestick chart, four price values are required: open, close, high, and low. When the opening price is higher than the closing price, the trend is downward and the candle is coloured black or red — sometimes called bearish, as the sellers (bears) maintained control. In the opposite case, the candle is white or green, indicating that buyers (bulls) had the upper hand. The wide body of the candle, known as the "jittai", represents the difference between the opening and closing prices of the trading session. Thin lines extending from the body are called "shadows" and show the highest and lowest price levels reached during that period. The line below the body is the lower shadow; the line above is the upper shadow. They reflect the session's minimum and maximum prices respectively.
There are three principles for analysing Japanese candlesticks.
- Body strength. This is based on the length of the candle body. The longer the body, the stronger the market's drive — upward for a white candle, downward for a black one.
- Shadow strength. Length is again the key criterion. A long shadow indicates that the market pushed strongly in a given direction but lacked the momentum to sustain it. A long upper shadow means buyers were unable to hold their gains, leaving bulls in a weak position relative to bears. A long lower shadow signals the opposite.
- The power of denial. If the market fails to move in the direction suggested by the first two principles, it will almost certainly move in the opposite direction. This is one of the most reliable forecasting principles in candlestick analysis.
By combining these three principles, traders can identify recurring patterns in market behaviour. Candlesticks reflect the psychology of the market — the hopes, moods, and fears of its participants.
A key advantage of candlestick analysis is that it can be used alongside other analytical tools. It is accessible to both beginners and experienced traders, and its effectiveness has been demonstrated by practitioners over many years.

We offer three Japanese candlestick indicators from different developers:
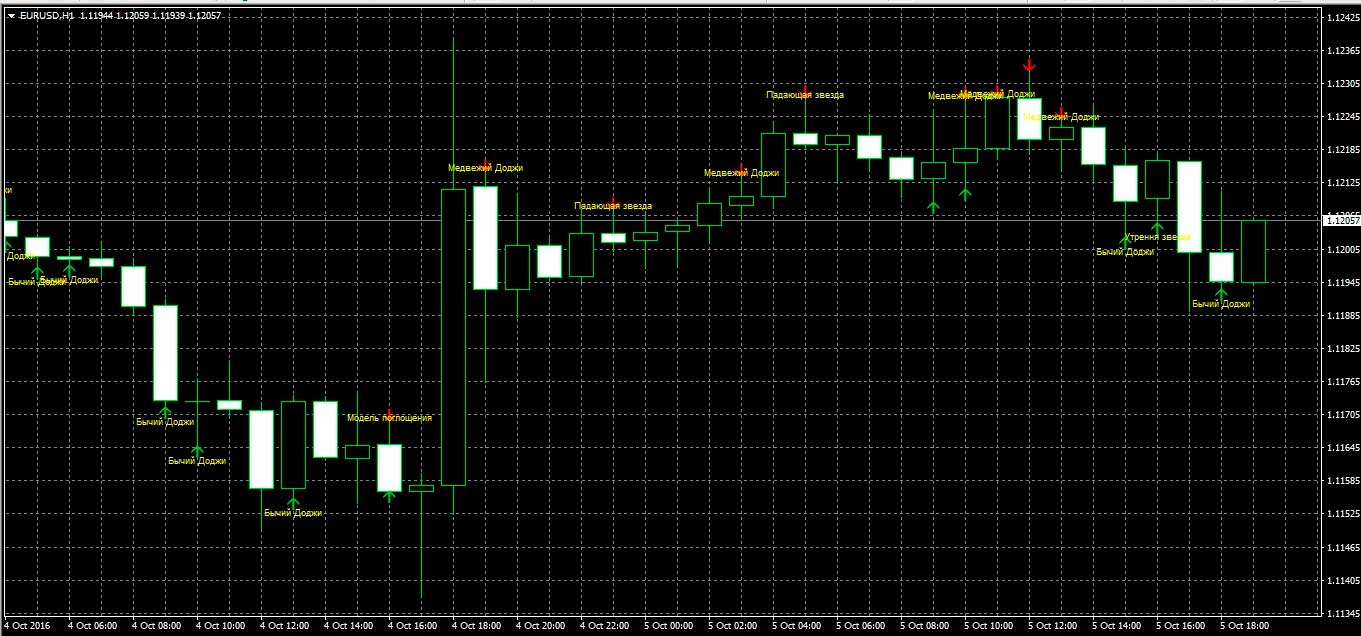
CPI Indicator "CandleStick Pattern Indicator" (Steve Nison's Legacy)
This indicator identifies all the major Japanese candlestick patterns and produces an audio alert when a pattern is detected.
Japanese candlestick patterns recognised by the indicator:
|
|
A description of these patterns is included in the PDF manual supplied with the indicator archive. CPI works with any currency pair, metals, and stocks across all timeframes.
CPI (CandleStick Pattern Indicator) settings:
- Show Strong Reversal Patterns — enable/disable strong reversal patterns
- Show Weak Reversal Patterns — enable/disable weak reversal patterns
- Show Continuation Patterns — enable/disable trend continuation patterns
- Show Unclassified — enable/disable additional patterns
- View Bars — number of recent candles to include in the analysis
- Sound Alert — enable/disable the audio alert when a candlestick pattern is detected
- Sell Color — arrow colour for bearish signals
- Buy Color — arrow colour for bullish signals
- Text Color — colour of text labels on the chart
Download the CPI Indicator
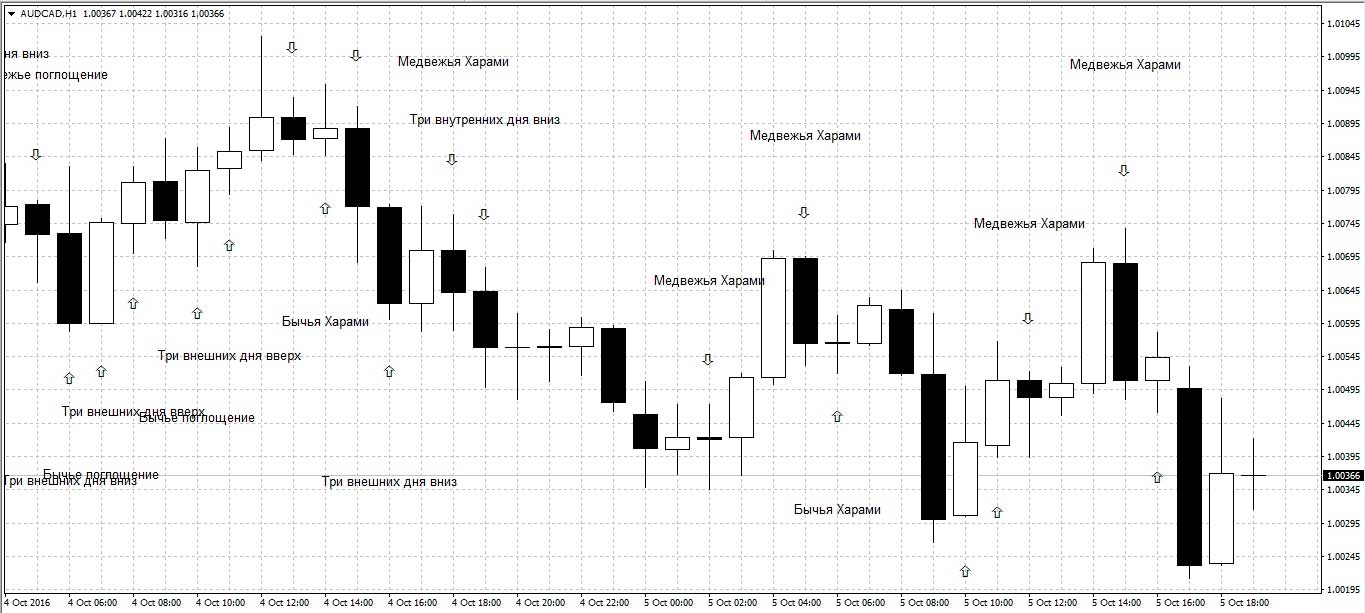
Japanese Candlestick Indicator
This indicator recognises fewer combinations and is best suited to the white colour scheme of the MT4 terminal.
Download the Japanese Candlestick Indicator
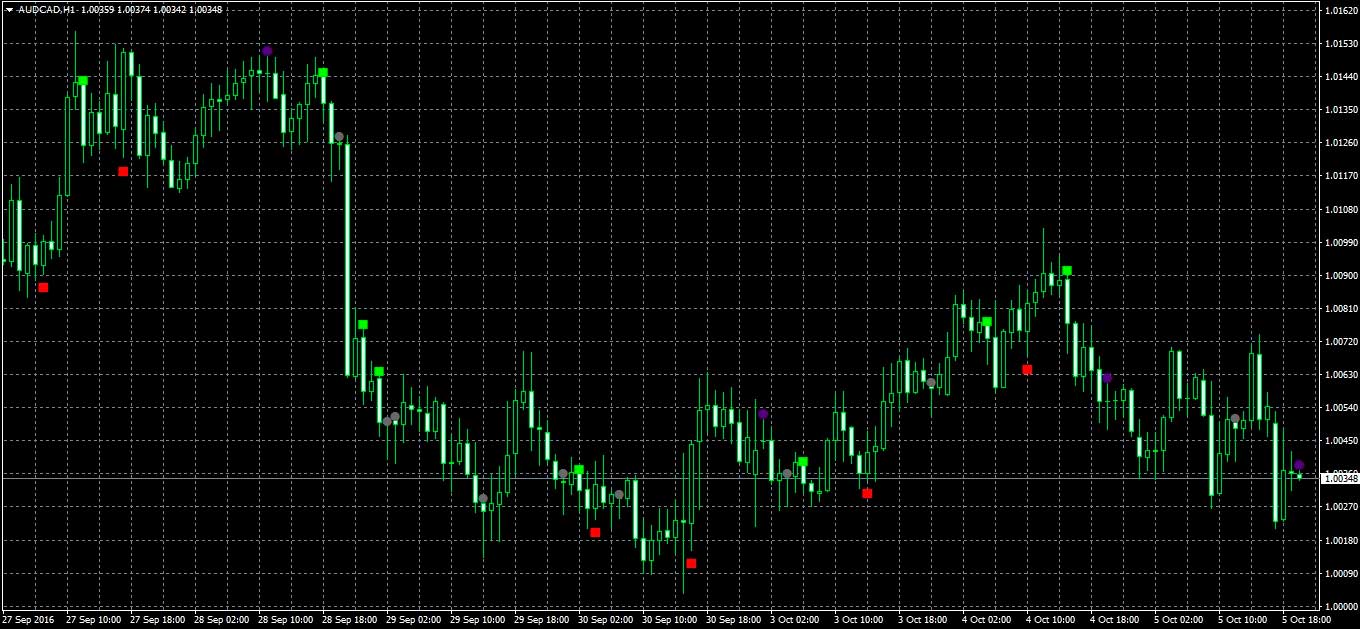
Japan Indicator
This indicator also recognises a smaller set of Japanese candlestick patterns and only displays pattern names on hover, but it is widely used and well regarded for its reliability.
Download Japan Indicator
When using any of these indicators, keep in mind that none of them constitutes a complete trading strategy. Each signal should be confirmed by at least one additional indicator or key level before entering a trade.
Not sure how a particular strategy or indicator works? Leave a comment on this article, and subscribe to our YouTube channel WinOptionCrypto — we answer questions in our videos.

To leave a comment, you must register or log in to your account.