Volume indicators display a histogram showing the number of shares or contracts traded at a given point in time, giving traders a view of overall trading activity.
Since true trading volumes cannot be determined in the Forex market — specifically on currency pairs — tick volumes can be used instead. These are what the Better Volume indicator is built on:
The Better Volume Indicator in Binary Options
Volume analysis is a method used across stocks, futures, and cryptocurrencies, and can also be applied effectively to binary options trading. Its key advantage over standard technical analysis tools is that it incorporates trading volume data. Since real volume data does not exist in the Forex market, the Better Volume indicator offers a practical alternative.
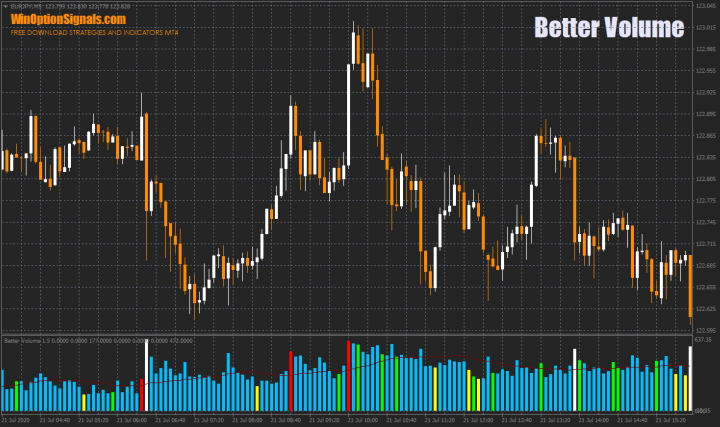
The Better Volume 1.5 indicator reveals the balance of power in the market — the relative strength of buyers versus sellers — and provides a broader picture of market conditions through volume data. High volumes appearing in the market signal the involvement of major market participants, which is strong confirmation of the momentum behind an existing bullish or bearish trend. It is precisely these participants — financial institutions, banks, and hedge funds — that initiate and end most market trends.
The Forex market is decentralised, making it very difficult to determine the precise volume of transactions executed on a specific instrument over a given period. As a result, real volumes and tick volumes can differ significantly. To enable meaningful analysis of currency pair behaviour, the Better Volume tick volume indicator was developed using a different algorithm from the standard Volumes indicator in the MetaTrader 4 terminal. It calculates its values based on ticks, which are available in every terminal — eliminating the need for real exchange volume data. A tick is the smallest unit of price movement for an instrument (typically the last decimal place). The Better Volume algorithm makes it possible to assess current market conditions and the potential for future price movement.
Installing and Configuring the Better Volume Indicator in MT4
The indicator is installed using the standard procedure in MetaTrader 4.
MetaTrader 4 instructions for installing indicators:
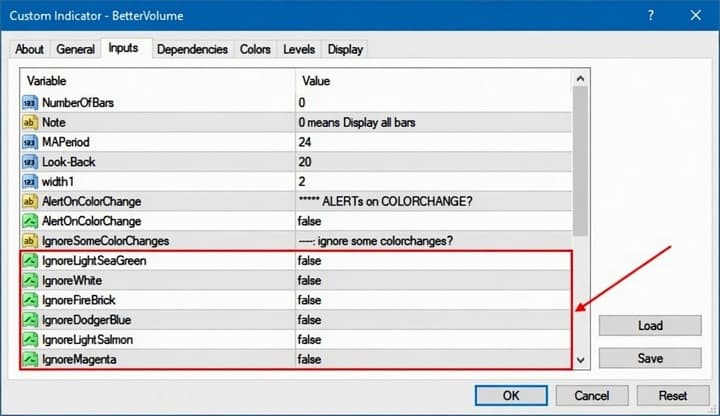
In the settings, you can adjust various parameters — for example, hide specific colours from the histogram display (colour meanings are explained below) or enable and disable alerts:
Trading Rules and Overview of the Better Volume Indicator
Standard volume indicators colour histogram bars in one or two colours depending on whether the corresponding candle is bullish or bearish. Better Volume goes further, colouring certain bars in distinct colours that carry specific analytical meaning:
Better Volume 1.5 assigns bar colours according to specific parameters, making it applicable to any market and any asset.
Colour meanings in the Better Volume indicator:
- Blue. Nothing unusual is occurring in the market — price is moving without significant involvement from major participants.
- Yellow. These bars are typically smaller than the others and indicate very low volume. Such conditions are common at the end of corrections or the end of trends.
- Green. These bars usually signal the presence of high volume, even if the bars themselves are not taller than previous ones. When green bars appear, many traders or major participants may be opening or closing positions. This does not necessarily mean an immediate price reversal — there are many other factors at play.
- Red. Buyers are currently dominant in the market, with a clear imbalance in their favour. These bars will typically be taller than previous ones. A reversal or correction often follows red bars.
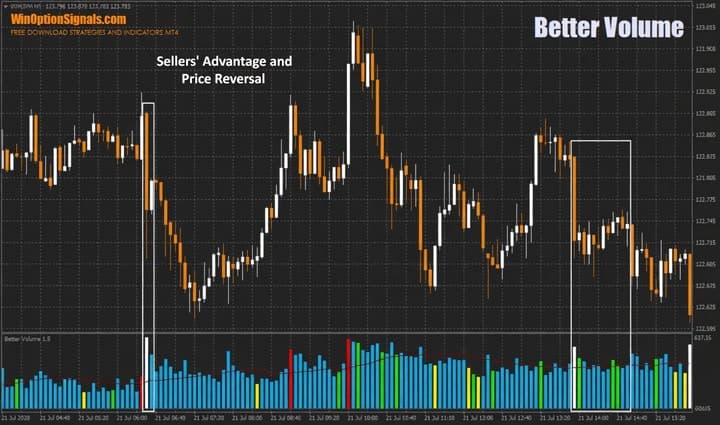
- White. Sellers have the advantage — this colour follows the same logic as red. A reversal or correction is also frequently observed after white bars.
Because Better Volume does not generate precise entry signals, it requires more analytical skill than simpler indicators. However, once you understand how it works, it can support high-quality market analysis and stand as a viable standalone trading tool.
Binary Options Trading Examples Using the Better Volume Indicator
Below are some illustrative examples of option entries using Better Volume. The most actionable signals come from red and white histogram bars:
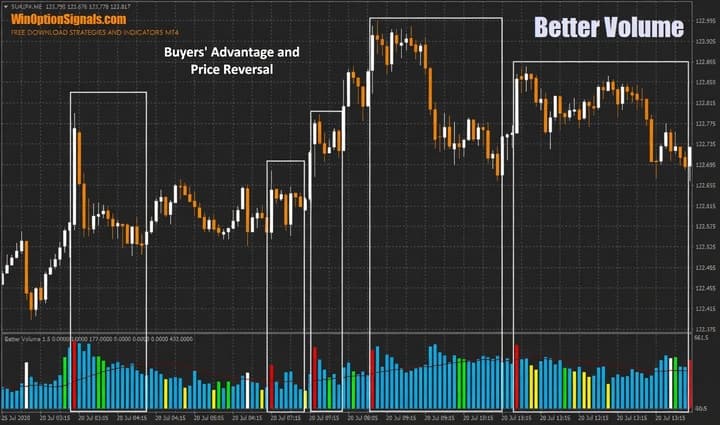
In this example, a buyer dominance signal preceded a price reversal.
When sellers hold the advantage, a reversal can also be expected — though it will not always be significant. A more comprehensive analysis approach is recommended in these cases:
Note: while these signals are fairly strong on their own, combining them with signals from other indicators or your own analysis is strongly recommended.
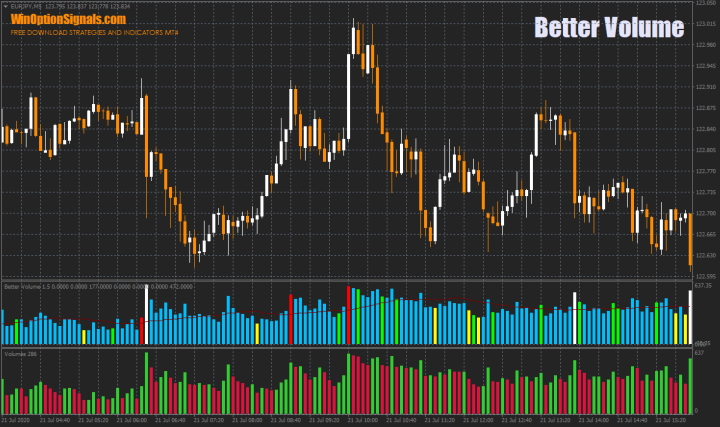
More complex analysis is also possible by examining several volume types together:
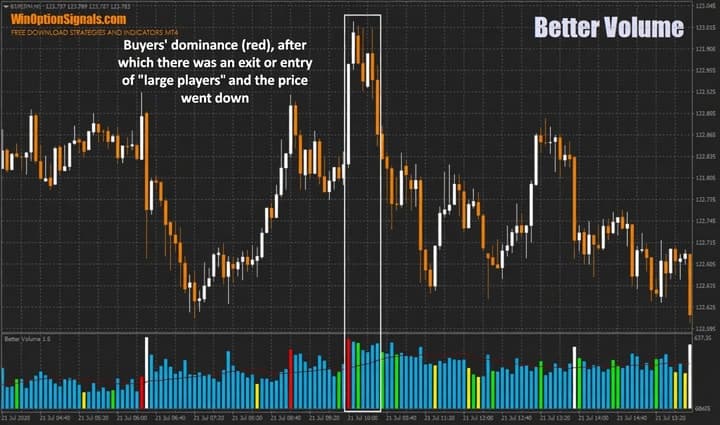
As shown, price did not reverse immediately after the red bar (buyer dominance) — it continued lower after a high-volume green bar appeared.
Conclusion
Using Better Volume 1.5 as the sole source of trading signals carries significant risk. For binary options trading, it is best combined with other binary options strategies or other forms of analysis.
Applying sound money management and risk management rules is also essential to protect your capital from significant losses.
Download Better Volume Indicator 1.5
Not sure how a particular indicator works? Leave a comment on this article, and subscribe to our YouTube channel WinOptionCrypto — we answer questions in our videos.

See Also:
- Binary options are a scam
- Forex trading session times
- How do binary options brokers make money
- Best Binary Options Brokers
To leave a comment, you must register or log in to your account.