Profitable binary options trading requires a grounding in core topics such as money management, risk management, and trading psychology, as well as the ability to identify a trend — and, specifically, to distinguish between bullish and bearish trends.
A trend is a sustained directional price movement that consistently sets new extremes. Statistically, markets are in trending conditions roughly 25–30% of the time — either in a bullish trend (upward movement) or a bearish trend (downward movement).

A bearish trend is a sustained downward movement — the analogy being a bear swiping downward with its paws. A bullish trend is a sustained upward movement — a bull driving upward with its horns. In both cases, exceptions exist and trends are not always clean, but the prevailing move in either direction is generally gradual and sustained. During a downtrend, selling pressure dominates and supply displaces demand; during an uptrend, buying pressure dominates and demand exceeds supply.
Why Is It Important to Trade Binary Options with the Trend?
The importance of trend-following is discussed in almost every trading book and article, and for good reason. Trends are the product of many converging forces — directional movement in a market never begins without a cause:
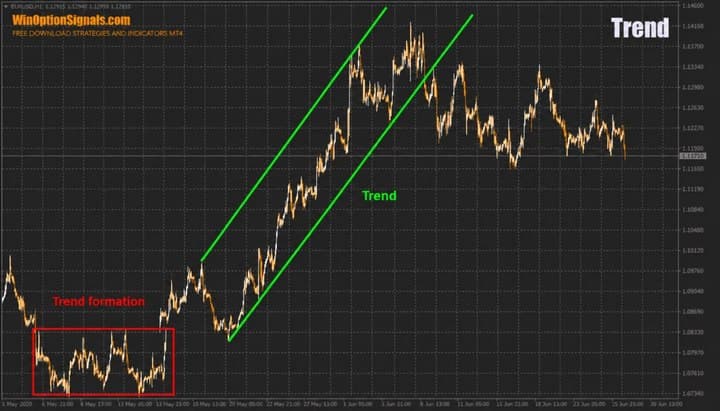
Note that before the bullish move began (H1 timeframe), a consolidation base — a flat — formed first. Reversing that upward trend requires a new base to develop, which means a genuine trend change will not happen in a single candle or a single hour. This is the core argument for trading with the trend: once a directional move is underway, it is unlikely to end quickly.
Shorter timeframes such as M1–M15 form their movements in the same way, but always in the context of the dominant direction on the higher timeframe.
How to Identify the Trend Direction for Binary Options Trading
Trend direction can be assessed visually, but this is only suitable for a quick initial read of the market. For trading purposes, more precise methods are needed.
Indicators offer one approach. A more widely used method is drawing channels or trend lines along price extremes:
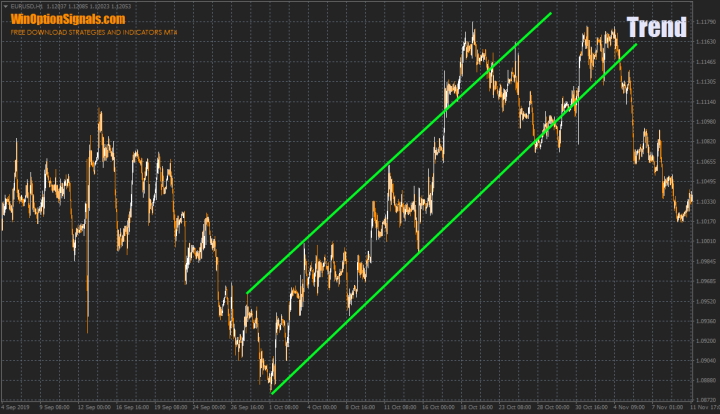
Price will not always move within a perfectly defined channel — adjustments will be needed over time. Note that a brief move above the upper boundary of an upward channel simply signals a strong bullish trend; it is a break below the lower channel line that signals a potential shift from bullish to bearish.
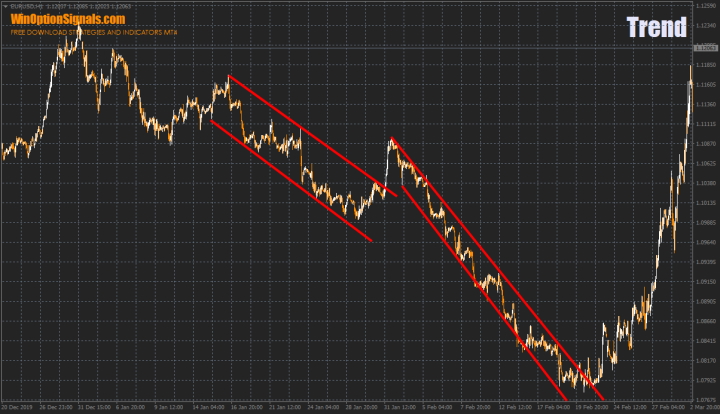
A downtrend is identified and drawn in the same way:
Identifying a Trend Change (Breakout)
Every trend eventually ends, giving way to either a flat or a reversal. The cause varies: for longer-term trends, a shift in the fundamental backdrop, an economic crisis, or a major geopolitical event may be responsible; shorter-term trends are more often influenced by localised supply and demand dynamics or market manipulation.
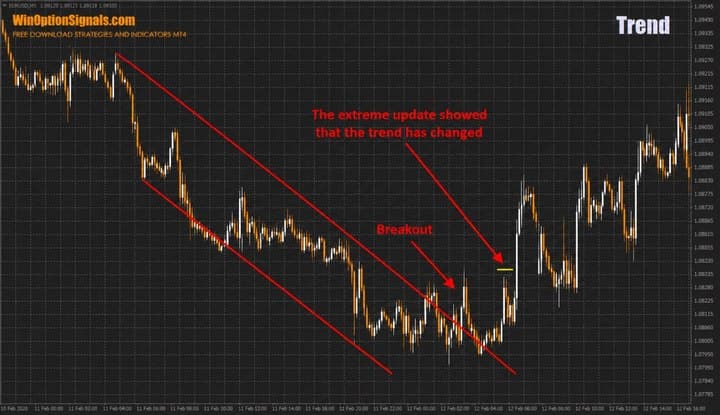
Regardless of the timeframe or cause, recognising when a trend is ending is critical. The same channel lines used to identify the trend serve as the tool for identifying its end. The key signal is a break of the opposite channel boundary followed by a candle closing beyond it. In an uptrend, this means price breaking below the lower channel line and closing there; in a downtrend, price breaking above the upper channel line and closing above it.
An example of a trend change during an upward move:
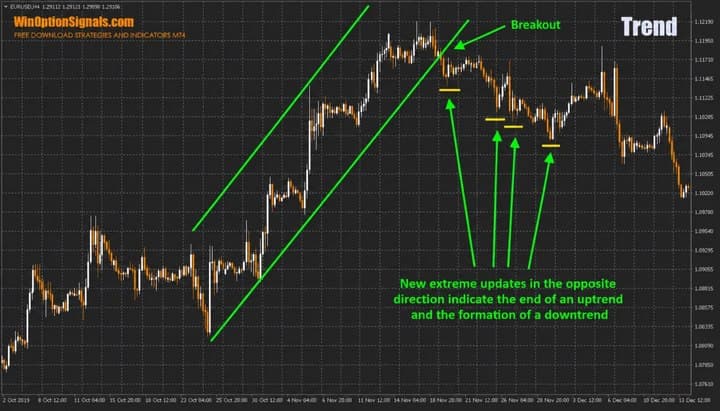
The breakout ended the uptrend, and the subsequent downward movement confirmed the reversal point.
The same approach applies to identifying the end of a downtrend:
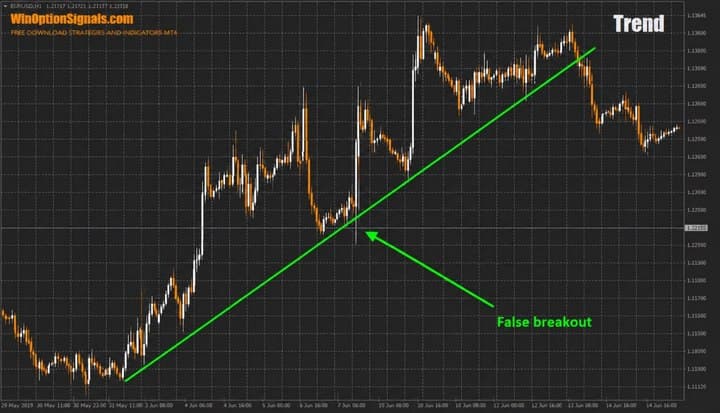
False breakouts do occur. In these cases, price moves beyond the channel line but returns inside it shortly after — and crucially, does not close beyond the boundary:
How to Trade Binary Options with the Trend
Identifying trend direction is straightforward enough, but trading profitably within a trend channel requires more than just drawing lines. Trading strategies and indicators that generate entry signals are the practical tool here. The rule is simple: during a bullish trend, consider only Call options; during a bearish trend, consider only Put options.
For example, using the Stochastic Oscillator:
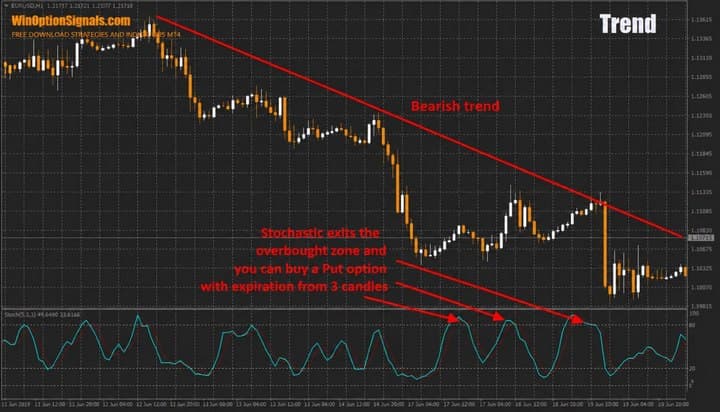
In this example, the trend is bearish — so only Put options are considered. Look for entries when the Stochastic exits the overbought zone, with expirations of at least 3 candles. The most reliable signals tend to appear when price is simultaneously approaching the channel line.
Conclusion
Trading with the trend is more consistently profitable than trading against it — across any market and any strategy. Every beginner should develop the ability to identify the current trend direction and avoid opening trades when direction is unclear or when a potential trend change is underway.

See Also:
- Are binary options a scam?
- What beginner traders need to know about binary options
- How do binary options brokers make money
- How to choose the right binary options broker
To leave a comment, you must register or log in to your account.