Moving Averages are among the very first indicators used by traders around the world and are suitable for virtually any market, including binary options, since they are based on average price.
This indicator is also one of the simplest and most intuitive, and is used across many strategies. Despite this, there are some nuances worth exploring in order to fully understand how the indicator works.
Types of Moving Average
The Moving Average is not as straightforward as it may appear — it comes in several calculation variants:
- SMA (Simple Moving Average).
- EMA (Exponential Moving Average).
- LWMA (Linear Weighted Moving Average).
- SSMA (Smoothed Moving Average).
Each of these has its own advantages and disadvantages, but there is little benefit in using them all in binary options trading, since they function in a broadly similar way. This article focuses on the most widely used variant — the SMA.
Adding the SMA Indicator to the Chart
The Moving Average indicator is available in any terminal and on almost every trading platform. One option for monitoring the indicator is a live chart for binary options. The more convenient option is to use the MetaTrader 4 terminal.
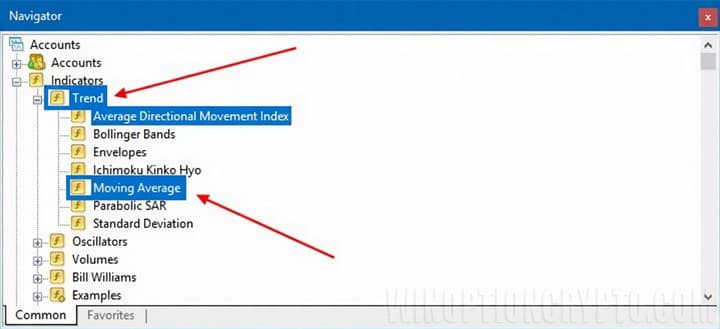
To add the indicator to the chart, go to the "Navigator" panel, open the trend indicators section, and select "Moving Average":
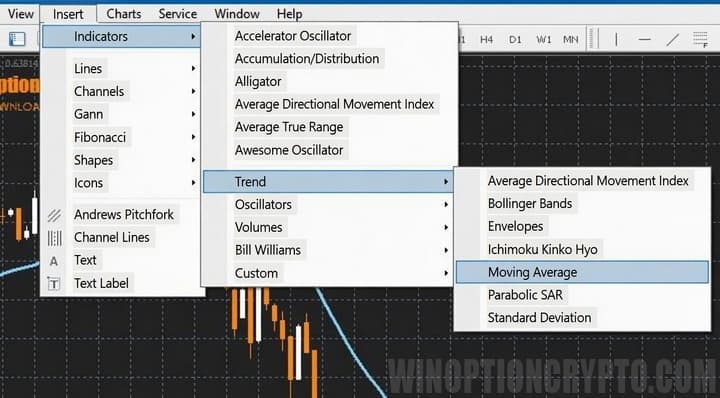
It can also be added via the top menu bar:
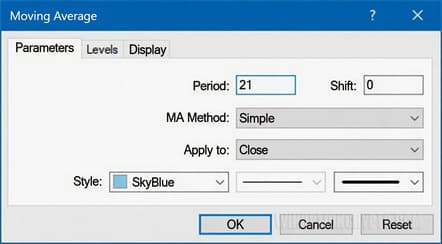
In the settings menu that opens, the following parameters can be configured:
- Period. The number of bars used to calculate the indicator line.
- Shift. A visual offset parameter.
- Method. Since we are working with the SMA, select "Simple".
- Apply to. The recommended option is always "Close" (closing prices).
- Style. A visual display parameter.
Instructions for installing indicators in MetaTrader 4:
How Is the SMA Indicator Calculated?
Today, all calculations are handled automatically by the terminal — though traders once had to do this by hand. The calculation itself is straightforward. Take a moving average with a period of 3 as an example: the indicator takes the closing prices of the last 3 bars and calculates their average. If the prices are 100, 150, and 180, the sum is 430, and dividing by 3 gives an indicator value of 143.33. The same logic applies to periods of 5, 10, 20, and so on.
How to Use the SMA Indicator in Binary Options Trading
The SMA indicator can be used in several ways. The most common applications are:
- Identifying the trend.
- Identifying momentum.
- Identifying support and resistance levels.
Each of these is covered in more detail below.
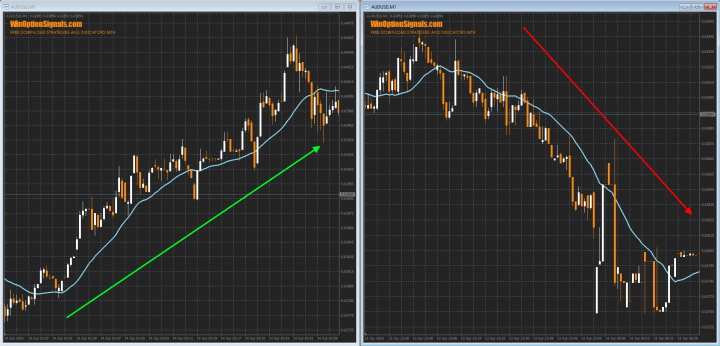
Identifying the Trend Using the SMA Indicator
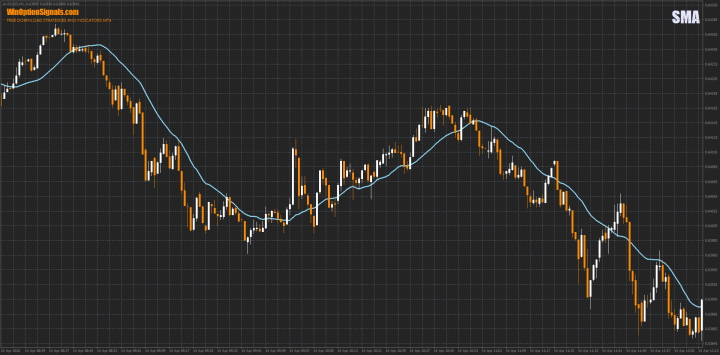
Identifying the trend with a simple moving average is straightforward. In an uptrend, price stays above the SMA line, and even when the line is briefly broken, price does not remain below it for long. In a downtrend, price stays below the SMA and rarely crosses the line from below:
In this example, a period of 21 is used. The higher the period, the more reliably the average reflects the trend — with fewer false breakouts. The chart below compares two different periods:
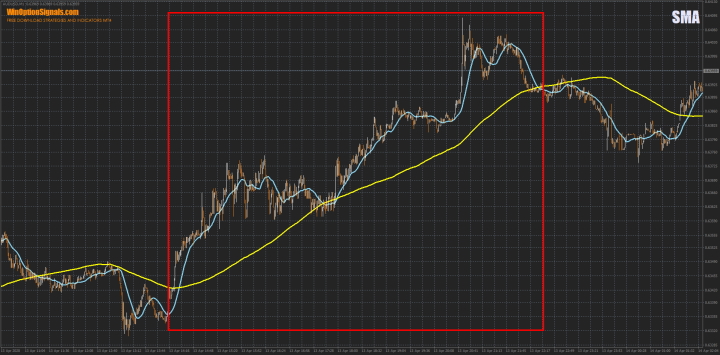
The highlighted area shows how the 21-period average captures only the local trend, while the 200-period average (yellow) reflects the broader trend direction.
Identifying Momentum Using the SMA Indicator
In simple terms, momentum signals that a trend is either ending or beginning. This method reflects the rate of change in price movement.
To identify price momentum, three SMAs with periods of 50, 100, and 200 are used:
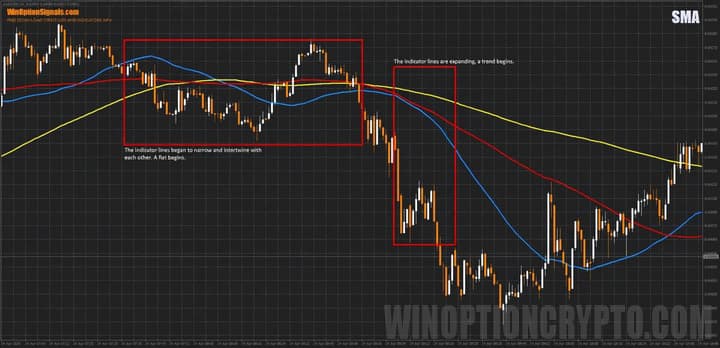
When the moving averages begin to intertwine, the trend is most likely ending and a ranging period is beginning. When the lines diverge from each other, a new trend is forming.
Identifying Support and Resistance Levels Using the SMA Indicator
The SMA indicator can be an effective way to identify support and resistance levels — though it should be noted upfront that periods below 200 are not well suited for this purpose:
In the chart above, periods of 50 and 100 are used. While there are some good bounces, breakouts in both directions occur far more frequently.
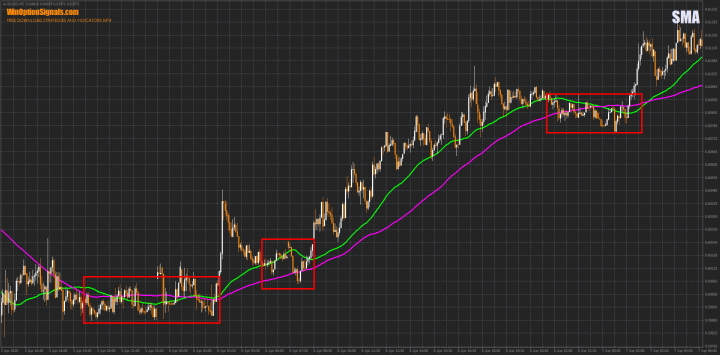
Below is the same section of chart using an SMA period of 200:
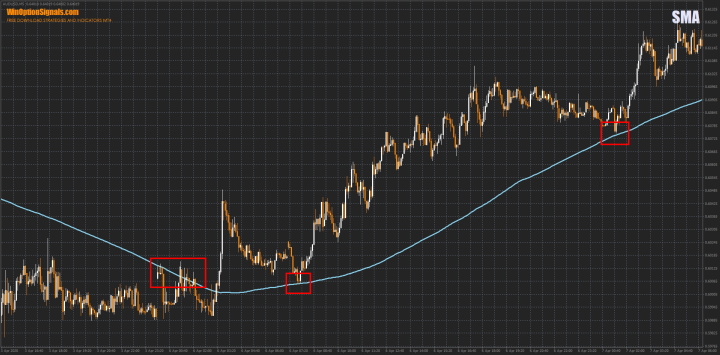
Price bounces cleanly off the level, and when price breaks through the indicator, former resistance becomes support.
Note that there is little value in looking for strong trend movements on timeframes below M5.
Conclusion
The Simple Moving Average indicator can be applied effectively in both binary options and Forex trading. It helps identify trends and ranging conditions, and also provides potential support and resistance levels that can be anticipated in advance.
As always, the best way to test any indicator or strategy is on a demo account — this allows you to build confidence without risking real funds. You can find a broker with a demo account in our binary options broker ratings.
Download the SMA Indicator Template
Not sure how a particular strategy or indicator works? Leave a comment on this article, and subscribe to our YouTube channel WinOptionCrypto — we answer questions in our videos.

To leave a comment, you must register or log in to your account.