The Stochastic Oscillator is one of the most popular technical analysis indicators, alongside tools such as MACD, RSI, and others. Stochastic is an oscillator-type indicator. It can be used for both binary options trading and Forex trading.
The indicator can be used in binary options trading for:
- Identifying the end of a correction within a trend movement.
- Determining entry points for both buying and selling.
- Trading in ranging (flat) markets.
The Stochastic Oscillator is well suited for determining when to open a position. One of its advantages is that it identifies overbought and oversold zones, which provide additional signals for entering a trade.
This indicator has been used by traders around the world for decades. It was created in 1950 by George Lane, who successfully traded using his own invention for many years.
The Essence of the Stochastic Oscillator Indicator
This type of indicator analyzes the speed of price movement within a defined range, using a specific minimum and maximum for a selected period. By reading data from the Stochastic Oscillator, a trader can assess which price action is more likely to occur at any given moment — whether the price will continue along the trend or reverse.
The indicator's creator based his approach on the observation that during a strong upward price movement, the closing price of the selected time frame tends to sit near the recent high. During a downward trend, the closing price tends to sit near the recent low. The Stochastic uses a series of algorithms to filter out "price noise," which improves the accuracy of its readings.
Stochastic Indicator Formula
The Stochastic is calculated using two variables: %K, known as the "fast" Stochastic, and %D, known as the "slow" Stochastic.
Formula for %K:
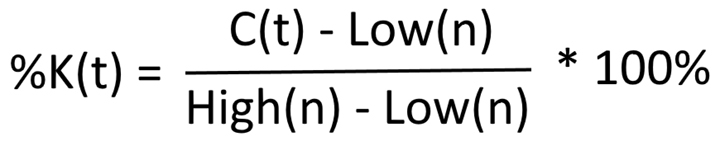
Where C(t) is the closing price of the selected period, and Low(n) and High(n) are the minimum and maximum of the previous ranges.
Formula for %D:
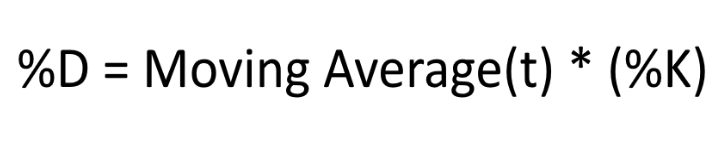
Research indicates that a simple moving average is appropriate for moderately volatile instruments, while exponential smoothing is better suited to highly volatile ones.
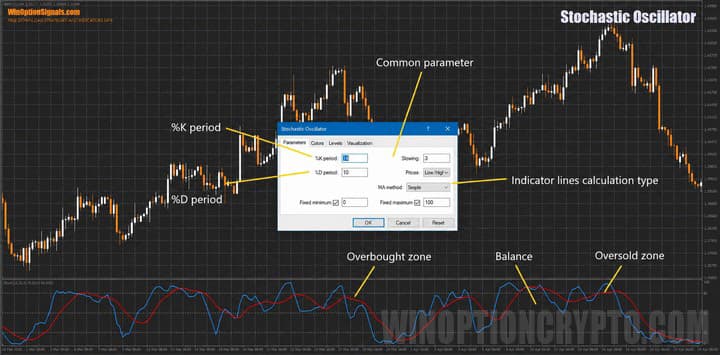
Stochastic Oscillator Indicator Settings and Data
The standard Stochastic is a built-in indicator in the MetaTrader 4 terminal, so no download is required.
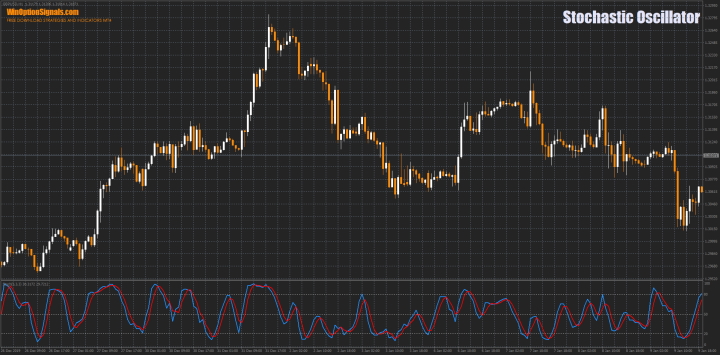
Like most oscillators, the Stochastic operates on a scale from 0% to 100%. These boundaries are displayed in the indicator window as gray dotted lines. The indicator typically uses levels of 20% or 30% and 70% or 80%. A 50% level can also be applied.
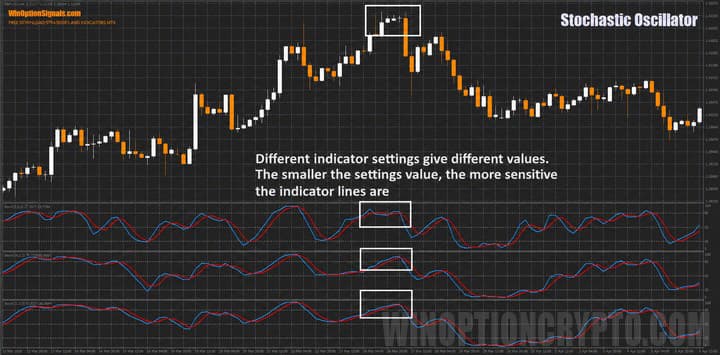
Default indicator parameters are not always well suited to modern markets — particularly since most traders work with currency pairs, whereas the indicator was originally designed for the stock market. It is therefore advisable to configure the indicator manually and test all selected parameters on a demo account.
The higher the time frame being analyzed, the lower the value you should select for the main Stochastic line. On longer time frames, the indicator responds more slowly and treats small fluctuations as insignificant.
Choosing the right settings requires taking into account the instrument's volatility, the time frame, and the asset type. For example, the standard 5-3-3 setting works well on major currency pairs. For short time frames from M1 to M30, settings of 9-13 tend to produce good results. For hourly time frames, the recommended parameters are 13-5-3, and for H4 and higher charts — values between 5 and 9.
Other Parameters in the Stochastic Indicator Settings
The remaining values in the Stochastic settings control the position range of the %K and %D lines. Increasing the Slowdown value brings both lines closer to the zero level, which is useful for long-term trading as it reduces the number of signals. Decreasing the Slowdown value causes the indicator to reach the overbought and oversold zones (20% and 30%) more quickly, allowing you to capture nearly every significant price reversal.
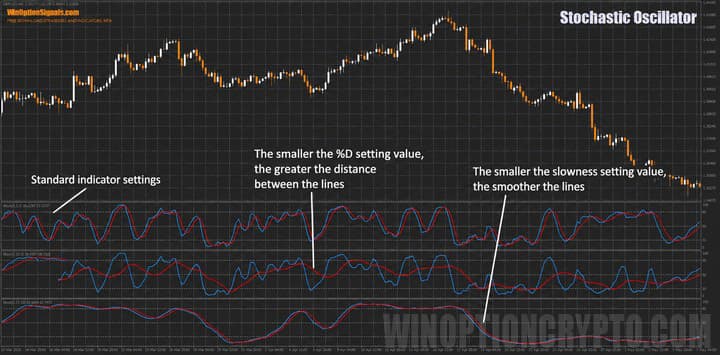
The %D ("smoothing") parameter determines how many %K values are averaged to plot the line. Setting this value to "3" means the indicator is plotted relative to the last three values. With this setting, the crossover points of the two lines shift relative to each other and to their extreme values.
Key Features of the Stochastic Indicator
- Terminal: MetaTrader 4.
- Time frame: selected based on trade type and indicator settings.
- Expiration: selected based on trade type and indicator settings.
- Types of options: Call/Put.
- Indicator: Stochastic Oscillator.
- Trading instruments: Any.
- Trading hours: 08:00–21:00 UTC.
- Recommended brokers: Quotex, PocketOption, Binarium.
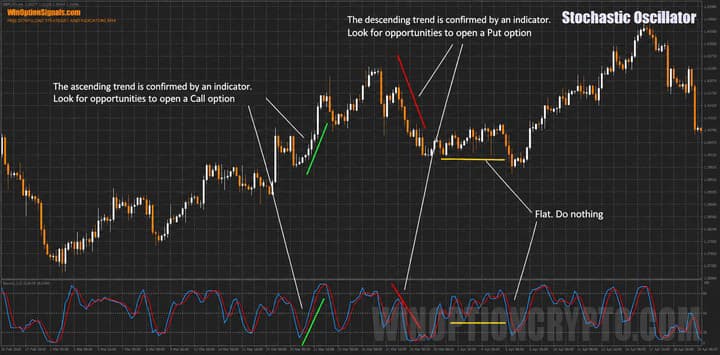
Signals for Entering a Trade from the Stochastic Oscillator Indicator
When the Stochastic Oscillator lines are in the overbought zone (70–80% to 100%), they are interpreted as bullish. When they fall into the oversold zone (20–30% to 0%), they are considered bearish.
When the indicator lines reach their extreme values, it generally indicates that the dominant side is exhausted or losing momentum — which typically leads to a reversal. It is also worth paying attention to the indicator's behavior around certain levels. When the Stochastic is near the 50% level, the probability of a reversal is relatively low.
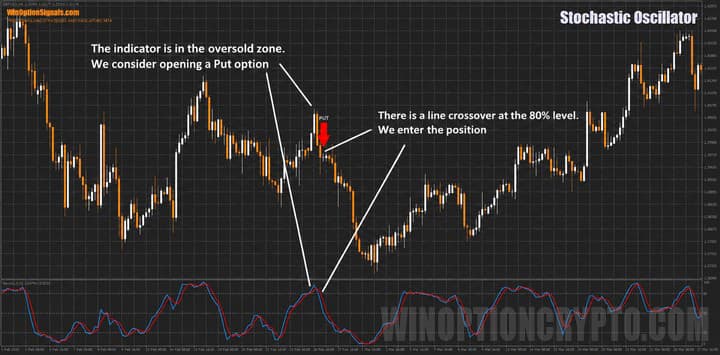
Overbought and Oversold Zones of the Stochastic Indicator
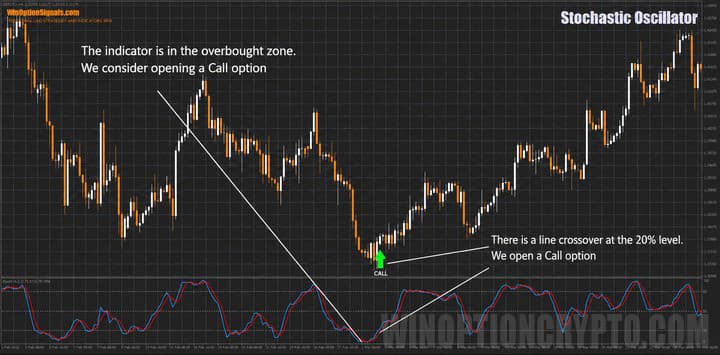
When the lines reach extreme zones, the following scenarios apply:
- An upward reversal of the indicator from the oversold zone (20–30%) is considered a signal to open a Call option. When the %D line crosses the 20–30% level from below, this provides additional confirmation of the signal.
- A downward reversal of the indicator from the overbought zone (70–80%) is considered a signal to open a Put option. When the %D line crosses the 70–80% level from above, this provides additional confirmation of the signal.
The prevailing trend can be considered active for as long as the indicator lines remain in the extreme zones.
Opening a Call Option
Opening a Put Option
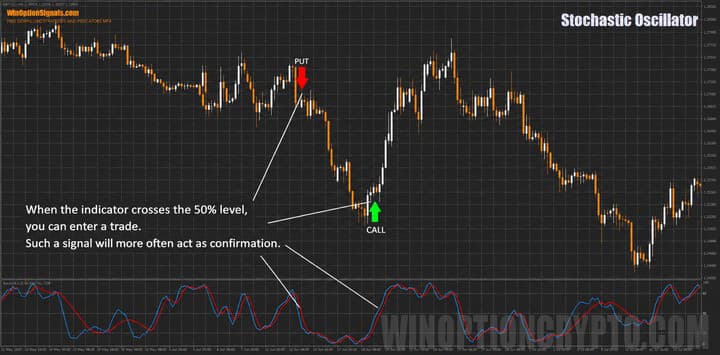
Breakout of the 50% Level by the Stochastic Oscillator Lines
The midpoint of the Stochastic shows which side generally dominates the market at any given moment — "bulls" (above 50%) or "bears" (below 50%). When the indicator lines sit at the 50% level, this signals market uncertainty. Once the indicator begins moving in a clear direction, that uncertainty resolves.
Opening a Call and Put Option
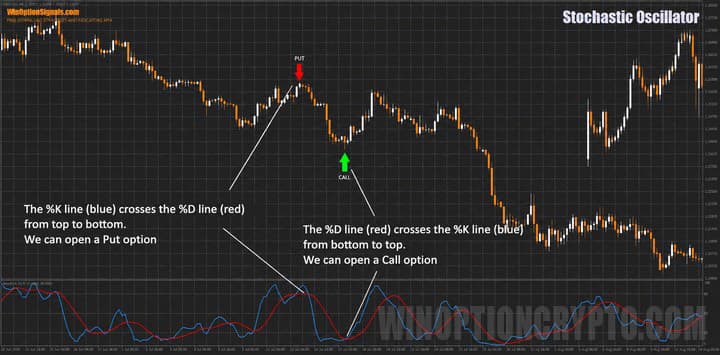
The Crossover of the K% and D% Lines of the Stochastic Indicator
In addition to the standard indicator signals, there are also secondary signals based on line crossovers. This approach works best with indicator settings of 14-10-3. It is worth noting, however, that these settings may not suit all assets — and they are particularly unsuitable for the M1 time frame, where they tend to generate a high number of false signals.
Opening a Call and Put Option
Divergences of the Stochastic Indicator
The Stochastic can also be used to trade divergences. The principles behind divergences are consistent across indicators — to understand how to apply them, refer to the article on the MACD divergence indicator and the Kwan NRP indicator for binary options. These articles provide comprehensive guidance on using divergences across any indicator that displays them.
If you plan to use the Stochastic for divergence trading, a modified version of the indicator with automatic divergence detection — along with a template — is available for download at the end of this article. The template in the archive is configured for the H4 time frame. If you need a different time frame, change the "Time Frame" value in the indicator settings.
Instructions for installing indicators in MetaTrader 4:
Pros and Cons of the Stochastic Indicator
The indicator's main strength is its versatility — it can be applied to any time frame and used to trade both trending and ranging markets. It also offers highly flexible settings, allowing each trader to tailor it to their own strategy.
Its main limitation is that it loses reliability in highly volatile markets, where sharp price movements cause the indicator lines to generate a large number of false signals.
Conclusion
As this article shows, the flexibility of the Stochastic Oscillator makes it suitable for use in almost any binary options trading strategy. That said, achieving accurate signals requires significant time spent testing and optimizing settings for a specific time frame and instrument. Despite its limitations, this indicator remains widely used by traders around the world.
Before using any indicator on a live account, always test it on a demo account first. If you are unsure which broker to choose, you can consult our binary options broker rating and select the one that best suits your needs.
Download Template and Indicator: Stochastic Oscillator Divergence MTF
Not sure how this strategy or indicator works? Leave a comment below, and subscribe to our YouTube channel WinOptionCrypto — we'll answer your questions in upcoming videos.

To leave a comment, you must register or log in to your account.