

| Signal time | Around the clock |
| Average accuracy of online signal forecasts | 79% |
| Martingale | Not used |
| Currency pairs | Major currency pairs, gold, silver, Bitcoin |
| Working timeframes | M5, M15, M30, H1 |
| Number of patterns | 50 |
| Recommended Brokers | Quotex, PocketOption, Binarium, Deriv |
Register — sign up to always be notified when new strategies are added.
This section is still being optimized, and your feedback matters to us — that's why we've enabled comments directly on the widget page. You can now ask questions and, most importantly, point out any issues. If you feel a pattern has produced an incorrect signal, please let us know and we'll look into it.
The most important consideration at this stage is choosing the optimal expiration time. It is currently set to 3 candles for all patterns, but you may be able to optimize it further.
How Can the Japanese Candlestick Widget Be Useful?
Japanese candlestick patterns are a powerful tool in Forex trading, which means they can also be effective when trading binary options — helping to identify the general trend direction. You can use these signals as a primary indicator of a trend change, combining them with other indicators for binary options or our online signals.
The widget currently detects 50 Japanese candlestick patterns: Hammer and Inverted Hammer, Bullish Harami, Bullish Engulfing, Short Candles in a Star Position, Morning Star (three-candle), Short Candle in Harami, Doji, Harami Cross, Piercing Line (Clearing in the Clouds), Double Push, Tweezers, Engulfing with Hammer, Piercing Line in Tweezers, Bullish Abandoned Baby, Strong Bottom (Fortress), Fast Break and Three New Lows, Bullish Meeting Line, Triple Gap on Dark Candles, 8–10 New Lows, Bullish Window, Bullish Play Ending with a Gap, Bearish Harami, Bearish Engulfing, Bearish Harami Cross, Three-Line Strike (Repulsed Attack of Three White Soldiers), Evening Doji Star, Doji in Star Reversal Position, Bearish Pincers, Bearish Window, Evening Star (three-candle), Bearish Meeting Line, Bearish Three-Line Breakout and Resistance Line, Hanging Man, Bearish Abandoned Baby, Strong Top (Fortress), 8–10 New Highs, Bearish Play Ending with a Gap, Three White Soldiers, Three Crows, Three Methods (Rise and Fall), Bearish and Bullish Tasuki Gap, Three Simultaneous Wings, and Bullish Gap Edge-to-Edge of White Lines.
50 Basic Combinations of Japanese Candlesticks. Determining the Trends
Most experts agree that the candlestick chart is the most convenient way to display an asset's price movement. The color of a Japanese candlestick along with the ratio of its body to its shadows reflects the ongoing battle between bulls and bears over a given time interval. Various candlestick combinations provide insight into market trends and, when used alongside other technical analysis tools (indicators, chart patterns, support/resistance levels), can help predict trend reversals. In this article we examine the main patterns that signal a change in direction or, conversely, the continuation of a price rise or fall. The term "pattern" refers to a combination or formation made up of several Japanese candlesticks.
The most widely used interval chart today has been known since the 18th century. The candlestick method is credited to Homma Munehisa, a major rice plantation owner who was an active participant in Japanese rice exchange trading. He sought a clear way to visualize the highest and lowest prices as well as the opening and closing prices over a given time period. Due to Japan's isolation from the outside world, the candlestick method of displaying price dynamics only reached Europe and the United States in the late 20th century, largely through the work of trader and analyst Steve Nison. Exchange participants quickly recognized the value of Japanese candlesticks, and they largely displaced other charting methods such as bar and line charts, becoming one of the key tools of technical analysis. Japanese candlesticks not only clearly show the direction of price movement but also help traders gauge the current sentiment of buyers and sellers.
Candlestick Patterns Indicating a Reversal of a Downtrend
The first Japanese candlestick patterns we will describe are the "Hammer" and "Inverted Hammer". The Hammer is characterized by a long lower wick (shadow), no upper shadow, and a short light body. The Inverted Hammer has a long upper shadow and a short dark body, with no lower wick. Both patterns typically form at the end of a downtrend and signal an upward price reversal:
The Bullish Harami pattern consists of two candles: the first has a long dark body, and the second has a short light body contained within it. The first candle is, so to speak, "pregnant" with the second — and "harami" is indeed the Japanese word for "pregnant":
The reverse pattern is called "Bullish Engulfing". Here, a small dark-bodied candle appears first, followed by a light candle with a long body that engulfs it:
These two patterns are more common than most others. Those described below form considerably less frequently.
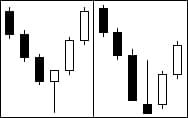
Short Candles in a "Star Position". A star is a compact candle with a short body and wicks. It should form below the preceding candle (typically one with an elongated body) and be separated from it by a small price gap. The third dark candle appears above the second and is similarly compact in both body and shadows:
"Morning Star" (Three-Candle Pattern). The combination opens with a long dark candle, signaling a sharp price decline. The second star candle has a small body and opens with a gap from the first. The third candle is light and reflects a strong upward move. The final candle of the pattern should close at or above the midpoint of the first candle's body. Ideally, the star candle forms with a gap on both sides, though a gap relative to the third candle is rare:
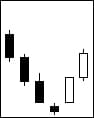
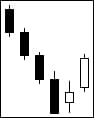
Short Candle in a Harami Position. This pattern differs from the Bullish Harami in that the second candle is dark rather than light. It is still contained within the body of the first candle. The third and final candle must be light:
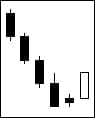
Doji candles form when the opening and closing prices are identical or nearly so. They resemble crosses — the body is extremely short or just a line, while the wicks are relatively long. Doji candles appearing among candles with large bodies can signal a potential price reversal:
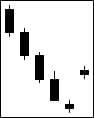
"Doji" in "Star Position". This combination is almost identical to the Short Candles in a Star Position, except that the short candles are replaced by Doji candles. If the candle following the Doji forms with a gap in the opposite direction to the trend, it is a strong signal that buyers gained control during the period the Doji was forming:
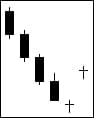
Harami Cross. Similar to the other Harami patterns, except that the second candle is a Doji. The pattern consists of two candles: the first has a long body, and the Doji is contained within its boundaries:
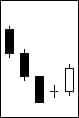
The Piercing Line is also known as "Clearing in the Clouds". The pattern consists of two candles. The first has a large dark body, and the second has a large light body. The right candle opens below the low of the left candle and closes at least halfway up its body. Notably, the further the second candle advances into the first, the higher the probability of a trend reversal:
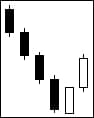
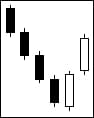
"Double Push". Here, following a dark downtrend candle, a light candle forms that opens below the low of the dark candle but does not reach its midpoint. The next candle is also light and closes higher. The light candles appear to "push" the bearish trend upward. If this combination repeats twice, a reversal becomes more likely:
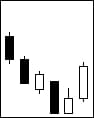
Tweezers (Forceps). The pattern consists of at least two candles forming in a falling market, where the candles share equal price lows. The individual candle types are irrelevant (large body, long wick, Doji, etc.). This pattern deserves particular attention after a prolonged decline, though it is generally not among the most reliable signals:
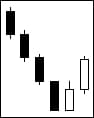
"Engulfing" combined with "Hammer". This is a three-candle pattern. The first candle is a Hammer, and the second and third form a Bullish Engulfing combination:
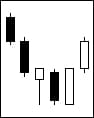
"Piercing Line in Tweezers" — this pattern consists of two candles and, as the name suggests, combines the two previously described formations:
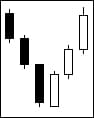
Bullish "Abandoned Baby". The pattern consists of three candles: a long dark candle, a Doji, and a long light candle. The central Doji candle is gapped below both its neighbors:
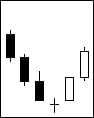
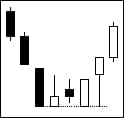
Strong Bottom (Fortress). This pattern typically marks the approaching end of a downtrend or a possible correction. It consists of three or more candles and concludes with a candle that opens with a gap and moves upward:
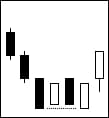
Fast Break + Three New Lows — in this pattern, a dark candle opens with a gap during a downtrend, followed by two more dark candles, after which a light candle also opens with an upward gap:
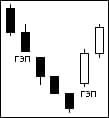
Bullish Meeting Line. A two-candle pattern. A dark candle forms on the first timeframe and a light candle on the second, with both closing at the same or nearly the same level:
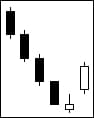
Triple Gap on Dark Candles. On the daily timeframe, this pattern consists of three dark candles, with each successive candle opening with a price gap below the previous one. It is a reliable reversal signal, as three consecutive days of decline leave the asset heavily oversold:
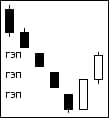
8–10 New Bottoms. These form during a strong bearish move, when the minimum price level drops over several consecutive timeframes. Traders typically close positions when a reversal candle or pattern appears after a prolonged decline. If light candles form eight to ten new lows during a correction, a trend change can be anticipated. If fewer than eight form, the count resets:
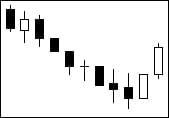
Bullish Window. During a prolonged downtrend, a light candle forms. This can be followed by a sharp upward move, with the next candle opening with a gap to confirm the reversal:
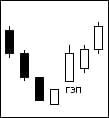
Bullish Play Ending with a Gap. This pattern features alternating light and dark candles trading within roughly the same price range, reflecting a standoff between bulls and bears. The pattern concludes when an upward gap occurs, triggering a trend change:
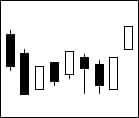
Below is an example combining four different patterns: Inverted Hammer, Strong Bottom, Doji, and Bullish Engulfing:
Candles and Candlestick Patterns Indicating a Reversal of an Uptrend
Bearish Harami. The mirror image of the Bullish Harami. A large light-bodied candle forms first, followed by a small dark candle contained within its boundaries.
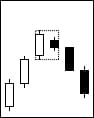
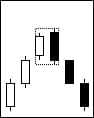
Bearish Engulfing. The reverse of the Bearish Harami. The left candle is short and light; the right is large and dark, with the body of the first contained within the body of the second:
Shooting Star. A compact light body with a very long upper wick and no lower wick:
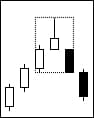
Bearish Harami Cross is formed from a large light candle paired with a Doji candle, which acts as the "baby":
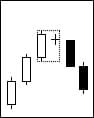
Three-Line Strike. This pattern also goes by the name "Repulsed Attack of Three White Soldiers." Despite the elaborate name, the formation itself is quite straightforward, as shown in the figure. Three light candles follow in sequence, with the closing level of each coinciding with the opening of the next. Shadows are absent or very short. The pattern is confirmed when the body of the third candle (sometimes the second) begins to shrink and the shadows lengthen. It deserves particular attention following an extended bullish move:
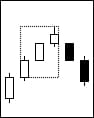
Evening Doji Star. This three-candle pattern begins with a light candle whose highs exceed those of the preceding candle. The second candle is a Doji whose body is also above the highs of the first. The third candle is dark, has no upper shadow, and should open with a downward gap from the closing level of the Doji:
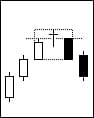
Star Spread. Like the previous pattern, this one consists of three candles. The first is light; the second is dark and opens with a gap above the high of the first. The third candle is also dark, has no upper shadow, and its opening level should match or slightly exceed the closing level of the second candle:
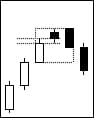
Doji in "Star Reversal" Position is nearly identical to the previous pattern, except that the second candle is a Doji. Accordingly, the final dark candle in the combination should open above the Doji's price high:
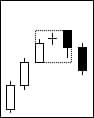
Bearish Pincers is a pattern of at least two candlesticks forming in an uptrend, where the candles share equal price highs. The individual candle types are irrelevant (large body, long wick, Doji, etc.). This pattern deserves particular attention after a prolonged rise, though it is generally not among the most reliable signals:
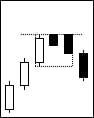
Bearish Window is a three-candlestick pattern. The first candle is light, but the second is dark and opens with a large gap below the closing price of the first (and even below its opening price). The third candle is also dark and forms roughly in parallel with the second:
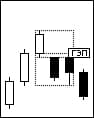
Evening Star. Also a three-candle pattern and the bearish counterpart of the Morning Star. The central candle has a compact body — the shorter it is, the higher the probability of a price reversal. It opens with a gap from the first candle; its body can be either light or dark. The third candle is dark, opens below the closing level of the middle candle, and should close at least halfway into the body of the first candle. The longer the final candle's body, the more decisive the bearish sentiment:
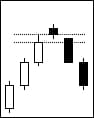
Bearish Meeting Line. A two-candle pattern. A light candle forms on the first timeframe and a dark candle on the second, with both closing at the same or nearly the same level. The third dark candle opens at the level where the second candle closed:
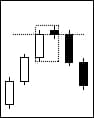
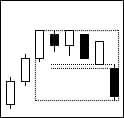
Bearish Three-Line Breakout + Resistance Line. This combination is clearly illustrated in the figure below:
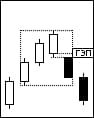
Hanging Man. This candle closely resembles the Hammer — it has a short body, no upper shadow, and a long lower wick. The key difference is that it forms during an uptrend. It can be either light or dark:
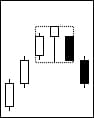
Bearish "Abandoned Baby". A three-candle pattern identical in structure to its bullish counterpart. It consists of a long light candle, a gapped Doji, and a long dark candle that also opens with a gap, as shown in the image:
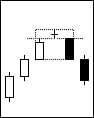
Dark Cloud Cover. The bearish counterpart of the Piercing Line. It consists of two candles — one with a large light body and one with a large dark body. The dark candle opens above the high of the light candle and closes below its midpoint. The longer the body of the final candle, the greater the probability of a reversal in price direction:
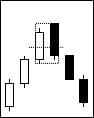
Strong Top (Fortress). This pattern typically marks the approaching end of an uptrend or a possible correction. It consists of three or more candles and concludes with a dark candle that opens with a gap from the preceding dark candle:
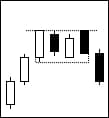
8–10 New Peaks. These form during a strong bullish move, when the maximum price level rises over several consecutive timeframes. Traders typically close positions when a reversal candle or pattern appears after a prolonged rise. If dark candles form eight to ten new highs during a correction, a trend change can be anticipated. If fewer than eight form, the count resets:
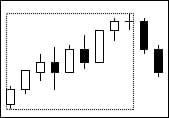
Bearish Play Ending with a Gap. The formation features alternating light and dark candles. Ultimately, a candle opens with an upward gap and the direction of price movement reverses:
Patterns Signaling Trend Continuation
Reversal patterns are relatively easy to spot on a chart and can be the basis for a solid trading strategy. That said, we also recommend paying attention to trend continuation patterns, as they help gauge the current mood of buyers and sellers and get the most out of a move.
Three White Soldiers. This pattern forms during a clear bullish phase and signals that the market is biased toward further growth. It consists of three light candles with no shadows or very short ones, with closing levels rising progressively. The opening levels of the second and third candles fall within the bodies of their predecessors, and there is no significant reduction in body size. When this pattern emerges after a prolonged bearish trend or a sideways consolidation, it signals that buyers are mounting a strong defense. A rise in prices can therefore be anticipated in the near term:
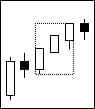
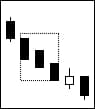
The mirror formation is "Three Crows". This pattern consists of three long dark candles with small wicks arranged in a descending staircase. The opening price of each successive candle falls within the body of the previous one. The pattern typically signals weakness in the bullish trend and the likelihood of a sharp price decline:
Three Methods (Rise and Fall). This pattern has an unusual structure and consists of five or more candles. The first long candle closes in the direction of the trend (and can be either light or dark), followed by several smaller candles — usually of the opposite color — before a final candle appears in the same color as the first:
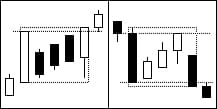
Let's examine the Three Decline Method in more detail. The first candle is dark with a large body and short wicks. The next three candles (sometimes two or four) have short light bodies and are contained within the body of the first candle. The final candle is long and dark, closing well below the low of the initial candle. After the pattern completes, price movement typically continues downward.
It is important to note that the last candle of the pattern must close above the high of the first candle (for the Three Decline Method) or below the low (for the Three Rise Method).
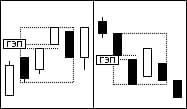
Tasuki Gap is applicable in both uptrends and downtrends. This three-candle pattern signals a continuation of the move. The first two candles should be bullish in an uptrend or bearish in a downtrend. A mandatory condition is the presence of a gap between the close of the first candle and the open of the second. The third candle is of the opposite color, opening within the body of the second candle and closing within the gap or slightly beyond it:
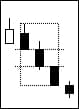
Three Simultaneous Wings. This pattern consists of three candles whose bodies form a regular staircase, with the second and third candles each opening at the closing level of the previous one:
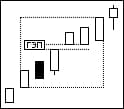
Bullish Gap Edge-to-Edge of White Lines. Consists of three light candles. The second and third have roughly equal body sizes, open at similar levels, and are separated from the first by a gap. If the closing level of the fourth candle exceeds the highest point of the pattern, continuation of the uptrend can be assumed:
Conclusion
To summarize, Japanese candlesticks are among the many technical analysis tools available for predicting market behavior and should be part of every trader's toolkit. Using them alongside oscillators and trend indicators can generate highly accurate signals for profitable trades. It is also worth remembering that effective capital preservation requires sound money management — maintaining an optimal risk-to-reward ratio is the foundation of consistent trading.

To leave a comment, you must register or log in to your account.