An essential skill for both beginner and experienced binary options traders is not only the ability to identify an upward or downward trend, but also the ability to recognise a sideways trend — or flat — since markets spend the majority of their time in this state.
Trend trading is relatively straightforward: the trader simply follows the price. A flat market is a different challenge entirely. Most traders struggle during sideways conditions, and most trading strategies and indicators for binary options begin to generate false signals when price is ranging.

What Is a Sideways Trend (Flat) in Binary Options?
A sideways trend — or flat — is price movement confined within a range. That range can be narrow or wide. It occurs when buyers and sellers broadly agree on the current value of an asset, so price oscillates within a defined band rather than moving decisively in either direction:
This type of market can occur across any asset class and on any timeframe — no asset trends indefinitely in one direction.
Whatever strategy or indicator you trade with, it is worth either adapting your approach for flat conditions or keeping a dedicated flat-market strategy available.
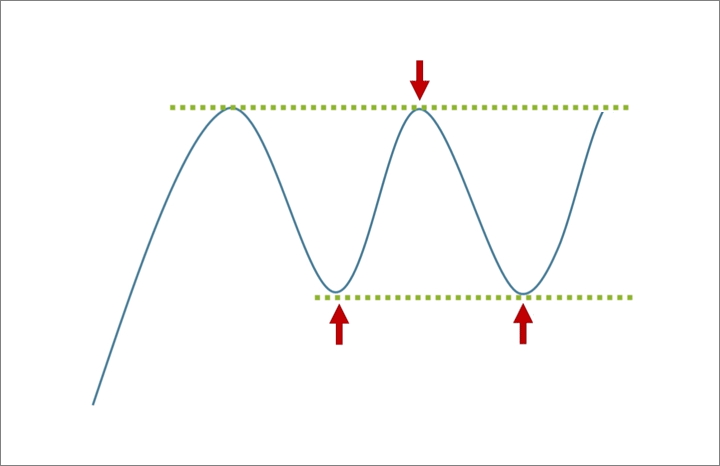
Just as bullish and bearish trends vary in form, sideways trends come in different varieties. The clearest is the so-called "ideal" flat:
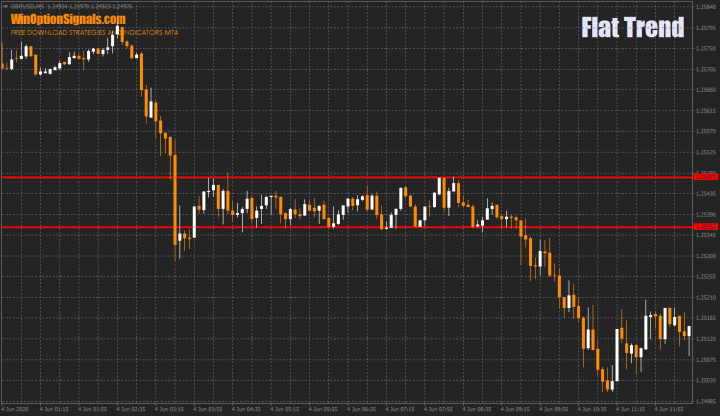
In this type of flat, the boundaries are well-defined and price respects them consistently until a directional breakout occurs. Sideways trends can also be far more complex and difficult to read:
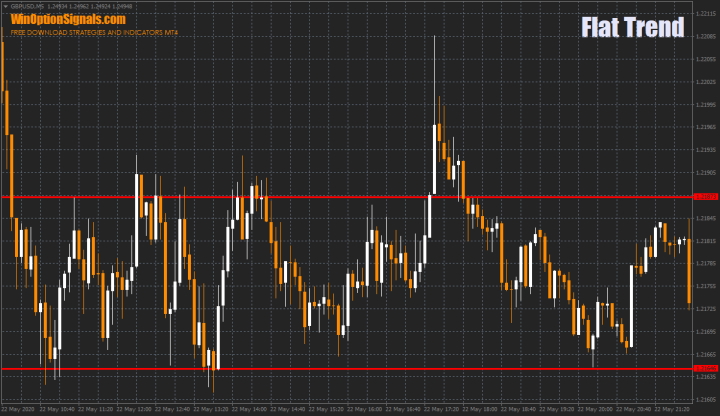
In these conditions, the flat is still present, but is characterised by numerous false breakouts and price formations that can create misleading impressions of a directional move.
How to Trade Binary Options in a Flat Market
It might appear that little activity takes place during a flat, with price simply drifting within the range. In fact, a significant number of trades occur even during sideways conditions. Those familiar with trend phases (accumulation and distribution) know that it is precisely during flat periods that large positions are built up — the foundation for the next directional move.
Traders who focus on strong trending moves will typically step back during flat conditions, which is perfectly consistent with that type of strategy. Scalpers, however, can trade at almost any time — the direction of the trend matters less to them than the predictability of the range.
Scalping in a flat is technically straightforward, with simple entry rules, but the real challenge lies in maintaining discipline and keeping emotions under control. Trading psychology is critical — without it, even a profitable strategy will produce inconsistent results.
The core rules are simple: buy Call options when price approaches the lower boundary of the channel (support), and buy Put options when price approaches the upper boundary (resistance):
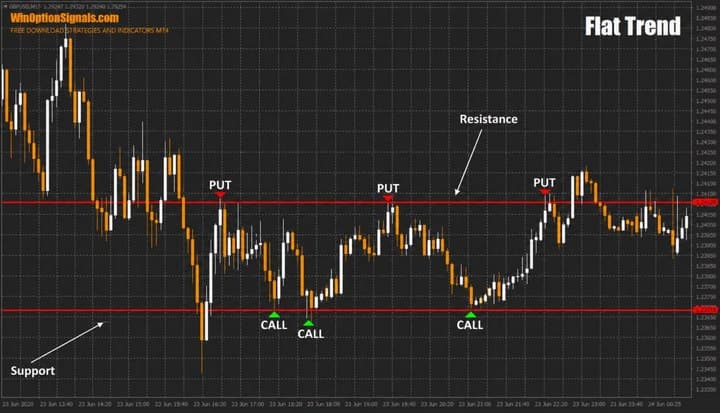
Set the expiration time relative to the width of the flat. On an M5 chart with a range of approximately 20 pips (4-digit quotes), an expiration of 3 to 4 candles is a reasonable starting point.
Once the flat breaks — typically signalled by one long candle or several consecutive candles closing beyond the range boundary in the direction of the breakout — stop trading the range immediately.
Indicators for Identifying Flat Market Conditions
Beginners often find it difficult to identify the prevailing market condition by eye alone. Several standard indicators in the MetaTrader 4 terminal can help confirm whether a flat is in place.
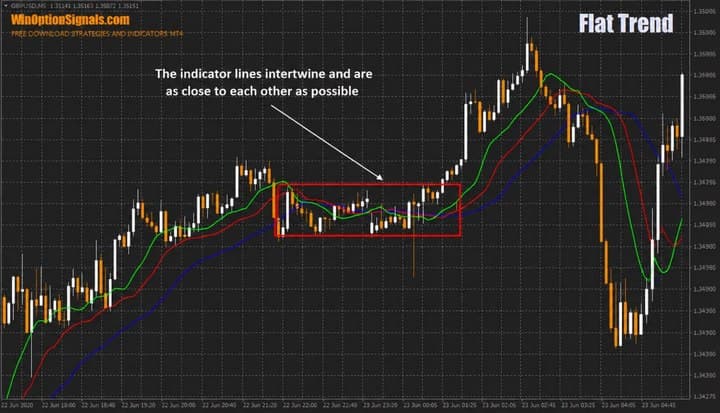
The simplest is the Alligator indicator by Bill Williams, which is built from three Moving Averages with specific settings. During a trending move, the three lines fan out and separate. During a flat, they converge and intertwine, with very little separation between them:
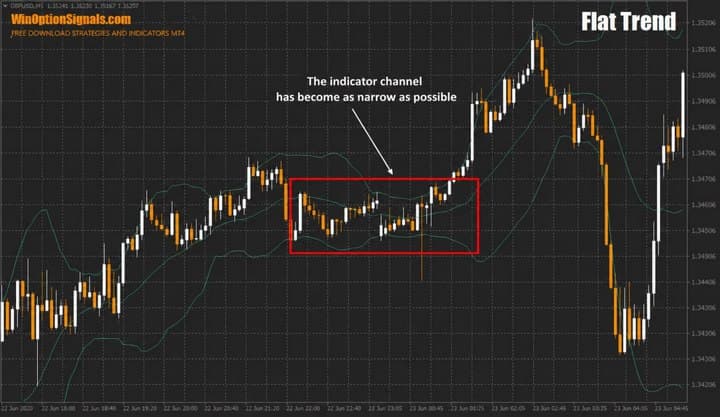
Bollinger Bands work on a similar principle. During a trend, the indicator's channel widens; during a flat, it contracts noticeably:
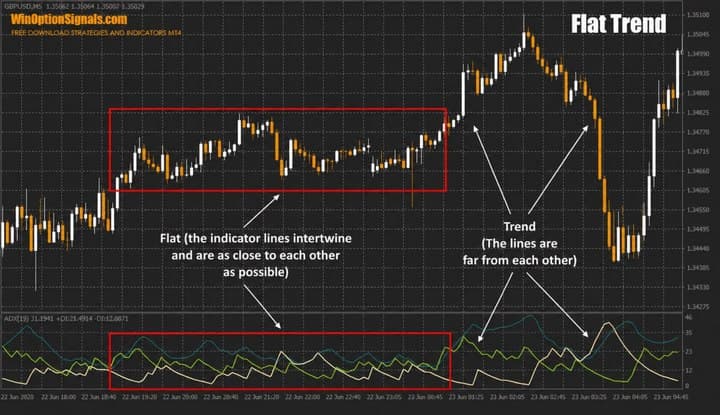
A third option — slightly more complex — is the ADX (Average Directional Index). The key lines to monitor are the two directional lines (shown here in green and beige). Their behaviour follows the same logic as the previous indicators: separation indicates a trend, convergence indicates a flat:
Conclusion
In traditional forex trading on the forex market or cryptocurrency trading on crypto exchanges, flat conditions are generally considered unfavourable — the ranges are narrow and profit potential is limited. In binary options, this disadvantage largely disappears: since profit is determined by the direction of the move rather than its magnitude, a well-executed flat strategy can be just as rewarding as trading a strong trend.
That said, no amount of strategy refinement removes the need for disciplined money management and risk management. Always back-test any new approach against historical data or on a demo account before applying it to live trading.

To leave a comment, you must register or log in to your account.