When trading through the Pocket Option platform, indicators play a key role. These technical analysis tools generate basic signals that help identify the optimal market entry point and predict the direction of price movement over a selected time interval — both factors that determine success in binary options trading. When working with the Pocket Option platform, technical analysis also tends to be more effective than fundamental analysis, which generally does not apply to this style of trading.
Contents:
- Rules for Selecting Indicators in Pocket Option;
- Pocket Option Indicators in the Mobile Version;
- Indicators in the Pocket Option Trading Platform;
- Accelerator Oscillator;
- ADX;
- Alligator;
- Aroon;
- Average True Range;
- Awesome Oscillator;
- Bears Power;
- Bulls Power;
- Bollinger Bands;
- Bollinger Bands Width;
- CCI;
- Donchian Channel;
- DeMarker;
- Envelopes;
- Fractals;
- Ichimoku Kinko Hyo;
- Keltner Channel;
- MACD;
- Momentum;
- Moving Average;
- OsMA;
- Parabolic SAR;
- RSI;
- Rate of Change;
- Schaff Trend Cycle;
- Stochastic Oscillator;
- SuperTrend;
- Vortex;
- Williams %R;
- Zig Zag;
- Examples of Using Pocket Option Indicators.
Rules for Selecting Indicators in Pocket Option
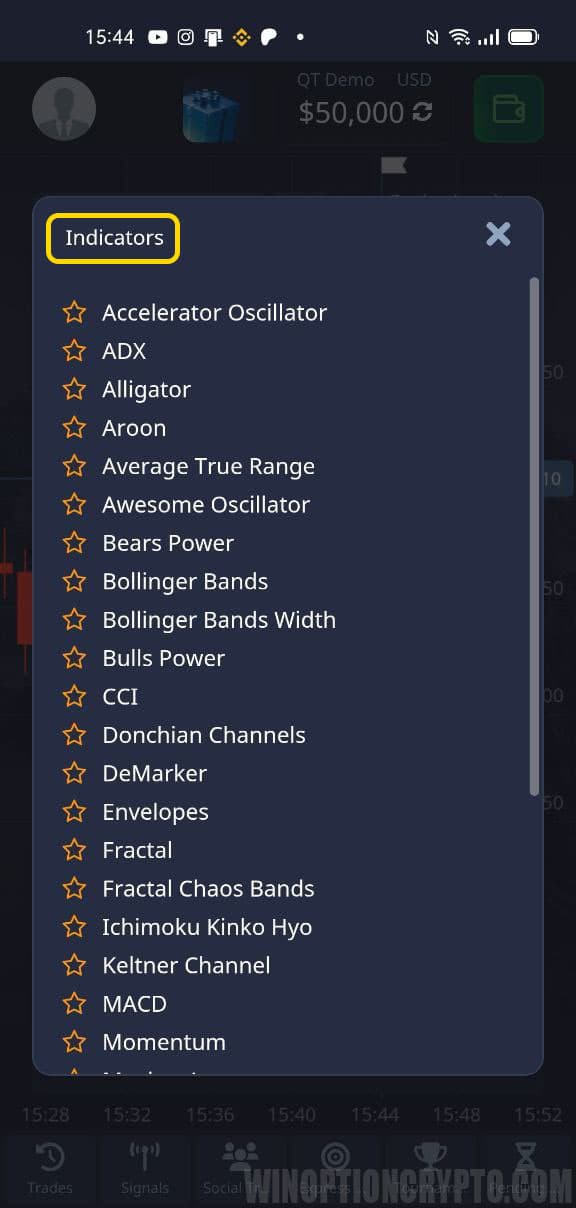
After launching the trading platform and selecting an asset, you can open the indicator menu by clicking the corresponding button on the main screen. A new window will appear showing the full list of available options:
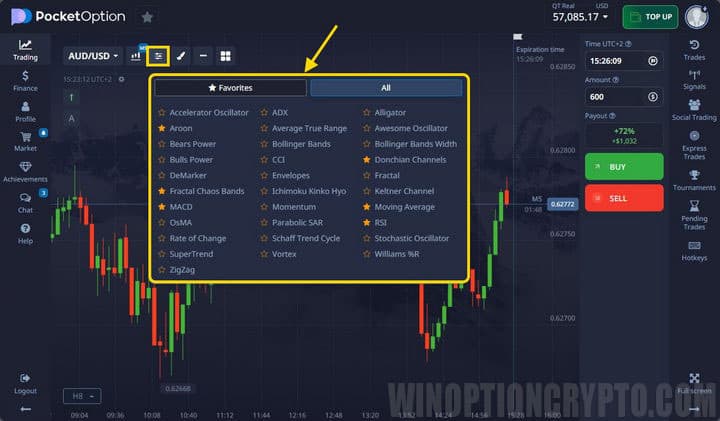
The broker's terminal offers a solid selection of indicators — 32 in total, which compares favorably with many other platforms. The available tools include:
- standard trend indicators;
- oscillators;
- channel indicators;
- complex tools (ZigZag, Fractals, Ichimoku);
- indicators popular among binary options traders (Schaff Trend Cycle, Vortex).
To add an indicator to the chart, click its name once — it will appear on the chart immediately. To adjust its settings, click the pencil icon:
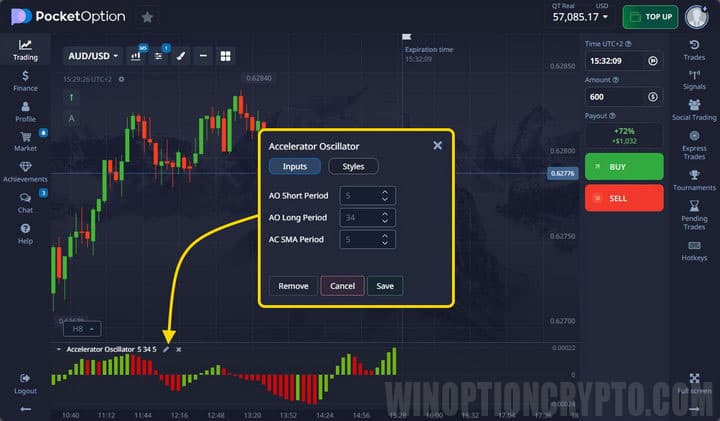
After applying an indicator, the updated chart is displayed on the terminal screen. All tools follow a standard layout — oscillators, in particular, appear in a separate panel below the main chart.
Settings can be adjusted at any time. The Pocket Option platform also supports advanced multi-chart tools, allowing traders to arrange charts according to their personal preferences.
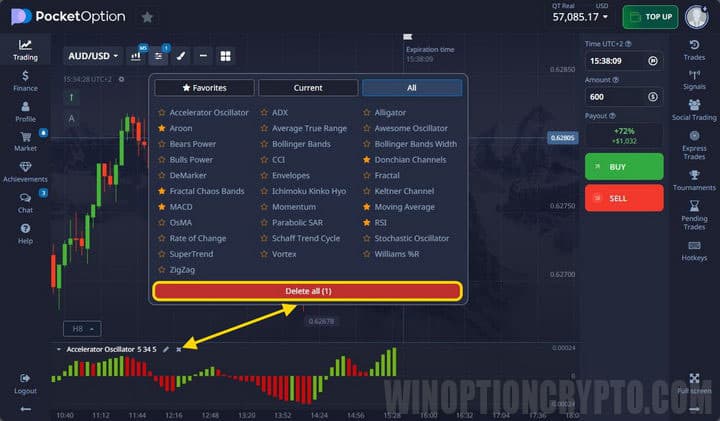
All active indicators are listed in the corresponding section. Individual indicators or the entire set can be removed from the chart using the X button or the "Remove all" option:
Pocket Option Indicators in the Mobile Version
Pocket Option offers traders a mobile trading terminal that matches the desktop version in most respects, though the two differ in several ways on closer inspection.
To access and configure indicators in the mobile terminal, tap the same button on the main screen:
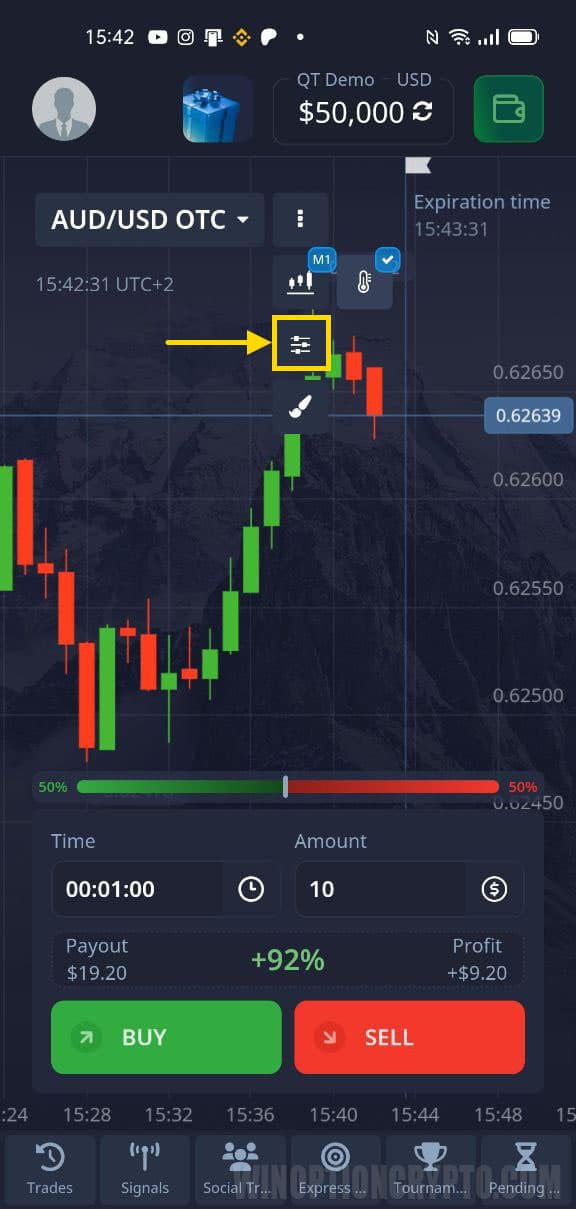
Compared to the web version, the mobile platform offers a smaller set of technical analysis tools:
- CCI;
- Bollinger Bands;
- ADX;
- Rate of Change;
- MACD;
- SMA;
- RSI;
- Stochastic.
Configuration works slightly differently in the mobile app. When you select an indicator, a list of available settings appears. Once configured, the indicator is automatically applied to the chart:
Active indicators are shown in the "Active" section, where you can remove some or all of them from the chart.
Some tools are more limited in the mobile version. For example, the maximum period for a standard moving average is capped at 35, compared to 250 in the web platform. The mobile version also does not support Pocket Option's social trading feature.
Training materials are only available through the web platform. For these reasons, the mobile version is best used for monitoring price movements rather than in-depth analysis.
Indicators in the Pocket Option Trading Platform
The platform's terminal includes both standard and proprietary indicators, so some tools here will not be found in MetaTrader 4. Below is a detailed overview of each.
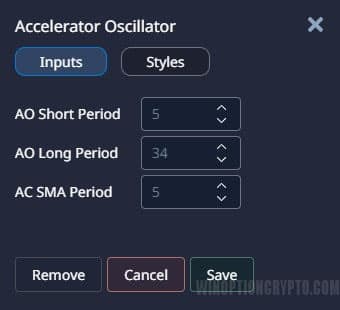
Accelerator Oscillator
The Accelerator Oscillator (AC) measures the acceleration and deceleration of price movement, tracking both momentum and price behavior. It features a midline that acts as a balance between acceleration and force. When readings are above it, prices have an easier time rising; when below, they are more likely to fall.
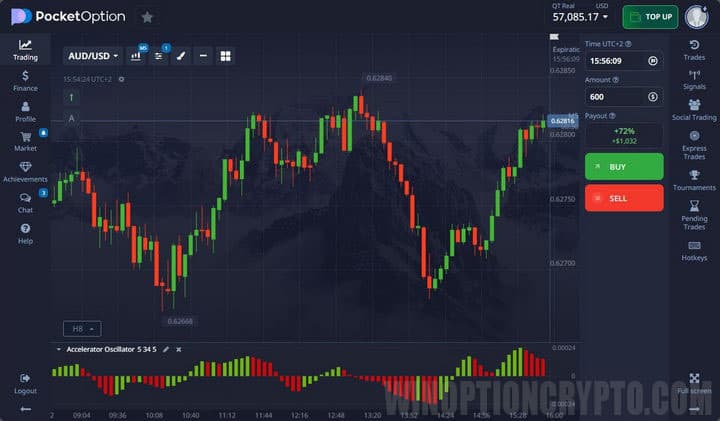
Adjusting the indicator settings changes the frequency of signals:
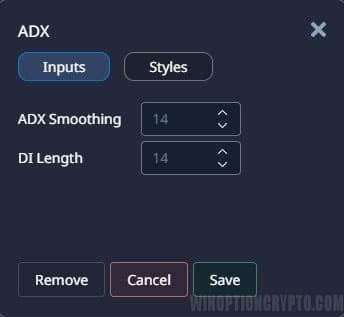
ADX
The Average Directional Index (ADX) is a directional movement indicator consisting of three lines. It compares price highs (+DI) and lows (-DI) and plots a smoothed average (the third line) based on them.
ADX identifies both the direction of price movement and its strength: the +DI and -DI lines indicate direction, while the smoothed average reflects trend strength.
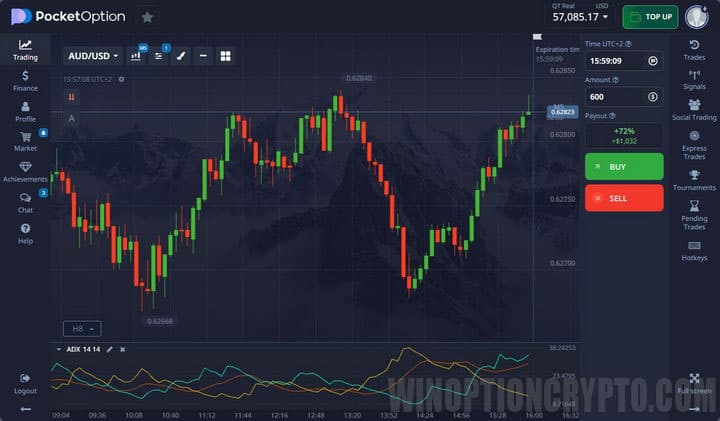
Settings rarely need to be changed, as ADX does not generate trade signals — it provides information about trend conditions only:
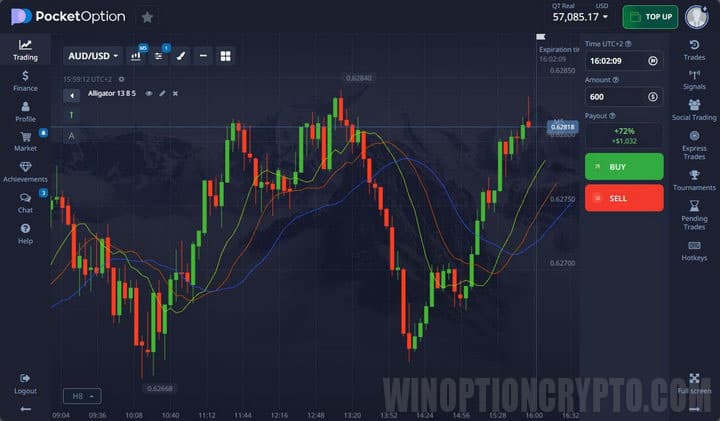
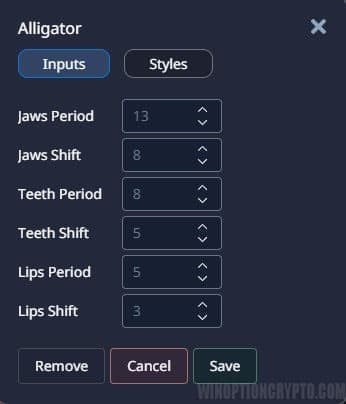
Alligator
The Alligator indicator consists of three smoothed moving averages with different periods and offsets, representing three parts of the "crocodile":
- Jaw — blue;
- Teeth — red;
- Lips — green.
When the lines intertwine, the market is ranging (the alligator is sleeping). When a trend begins, the lines diverge and the mouth opens (the alligator is hunting). Once the trend ends, the lines converge again (the alligator falls back asleep):
Default settings can be changed, though this is usually not necessary:
Aroon
Aroon is designed to identify trends and detect when the market transitions into a range. Its calculations are based on the time elapsed since the last price extreme. The default period is 25. A dedicated strategy using this indicator is also available: Aroon EMA.
When the red line is above 70 and the blue line is below 30, a bearish trend is indicated. The reverse conditions signal a bullish market. When both lines stay near the midpoint, the market is likely ranging.
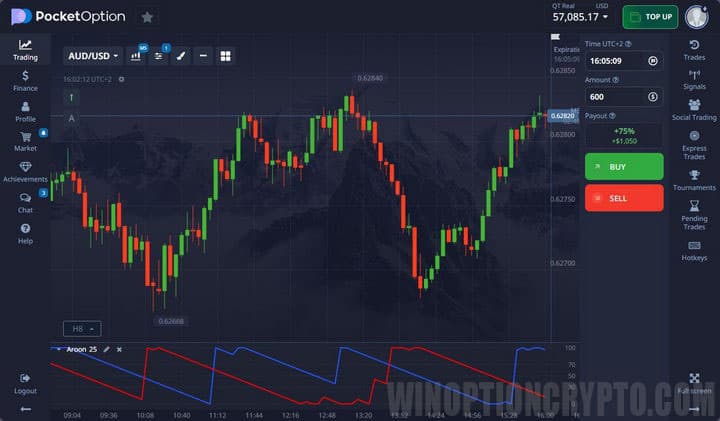
Only the period can be adjusted in the settings:
.jpg)
Average True Range
ATR measures price volatility. The indicator line rises when the price moves sharply in either direction, signaling increasing volatility, and falls when the price moves sideways for an extended period.
In practice, ATR is best used to gather statistics and estimate how much the price could move in the near term.
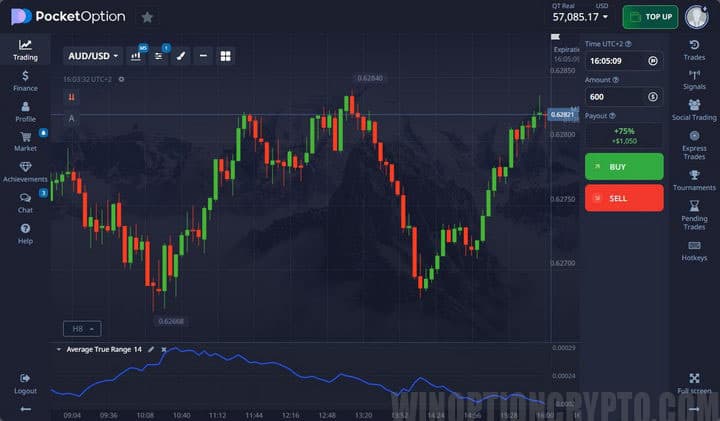
The period setting determines how many candles on the selected timeframe are used in the calculation:
.jpg)
Awesome Oscillator
The Awesome Oscillator (AO) is calculated using median prices ((high + low) / 2) for a larger moving average, from which the median prices of a smaller moving average are then subtracted. Its primary purpose is to measure market momentum.
Trades are taken on the "saucer" pattern or when the oscillator crosses the zero line. Divergences can also be identified using the Awesome Oscillator Divergence.
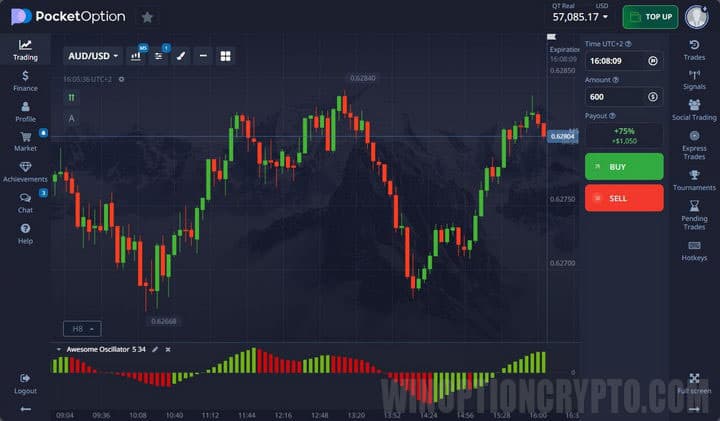
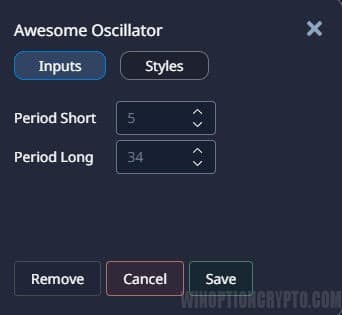
The moving average periods can be adjusted in the settings:
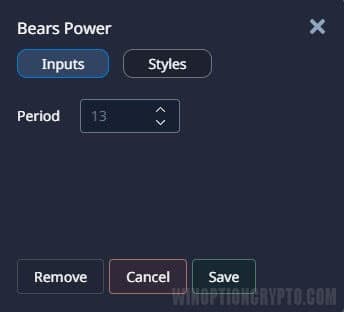
Bears Power
Bears Power measures the difference between price lows and the exponential moving average, reflecting the strength of sellers. It works best in combination with a standard moving average. When the moving average is pointing upward and Bears Power begins to rise, this serves as a Call signal; the reverse conditions suggest a Put:
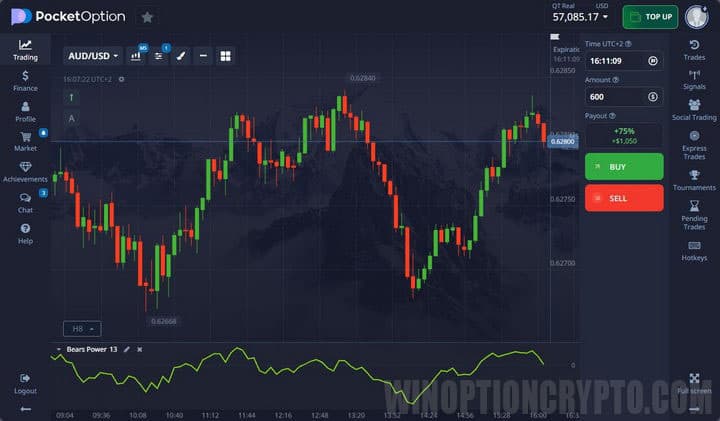
The period setting controls the timespan over which bearish strength is measured:
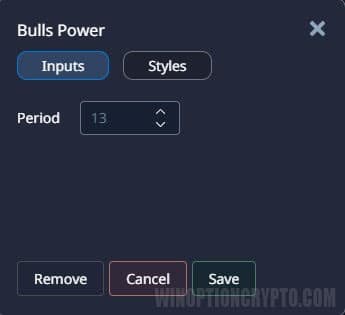
Bulls Power
Bulls Power uses the same calculation logic as Bears Power but measures the strength of buyers. It is used in trading in exactly the same way; combining the two is not meaningful, as they measure opposite forces:
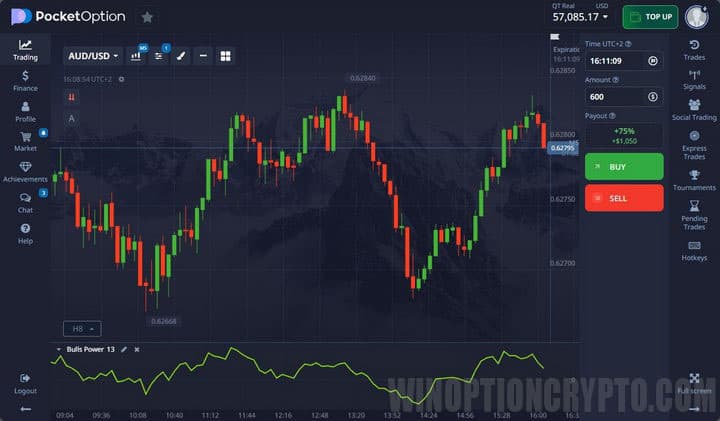
The settings also control the period in candles:
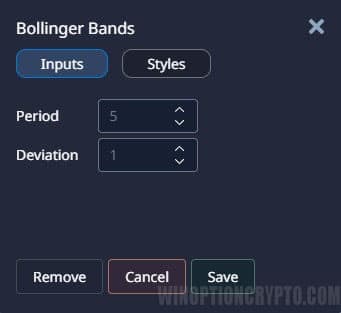
Bollinger Bands
Bollinger Bands (BB) combine trend detection, volatility measurement, and oscillator functionality. The direction of the bands reflects the prevailing trend, while the width of the channel indicates volatility — the wider the channel, the higher the volatility. During a ranging market, the bands narrow:
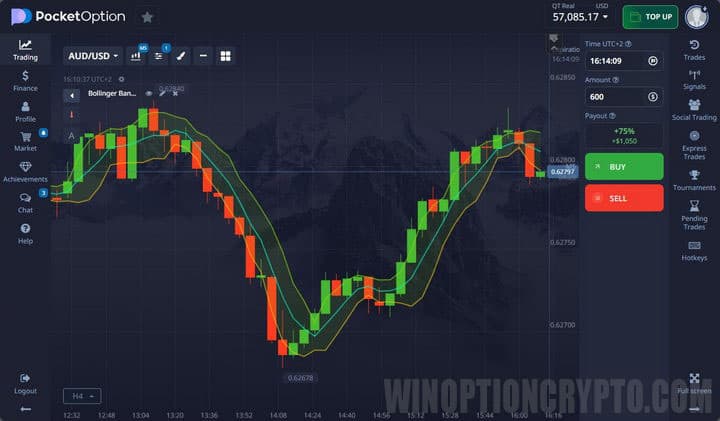
The period (in bars) and standard deviation can be configured:
Bollinger Bands Width
Bollinger Bands Width uses a different algorithm from standard Bollinger Bands but also measures trend and volatility. Use it alongside the base Bollinger Bands indicator for more precise signals:
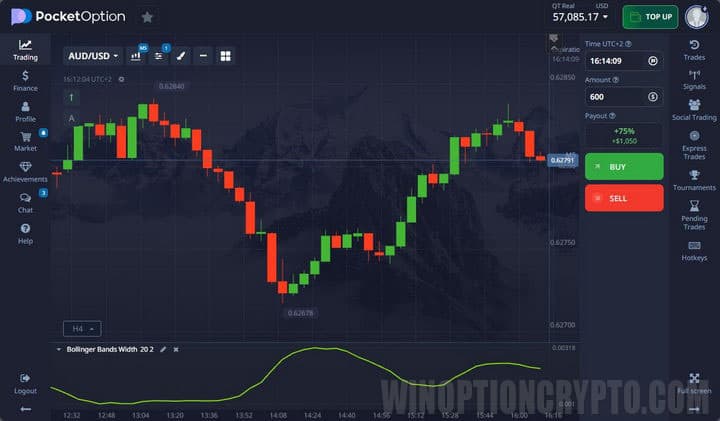
Settings are the same as for Bollinger Bands:
.jpg)
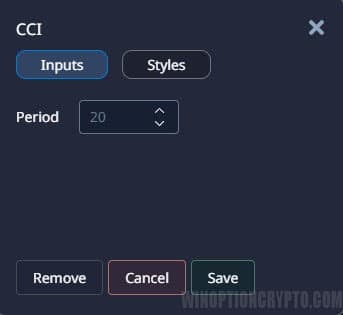
CCI
The Commodity Channel Index (CCI) is an oscillator that identifies overbought and oversold conditions by measuring how far price has deviated from its moving average. A reading above 100 or below -100 generates a standard signal, though many strategies built around CCI go well beyond these basic rules:
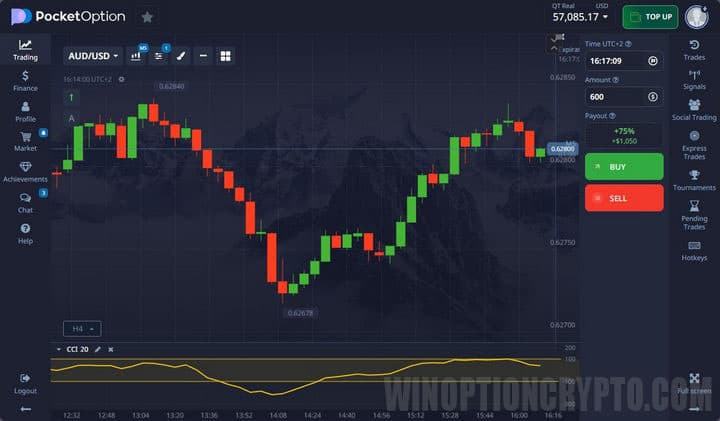
The settings control the period of the moving average from which price deviation is measured:
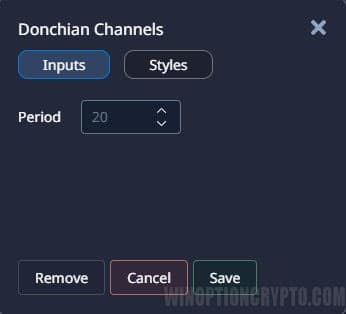
Donchian Channel
The Donchian Channel is built using the highest and lowest prices over a defined period. Trades are taken on breakouts in the corresponding direction. The midline can also be used as a reference:

The period for calculating the high and low values can be adjusted:
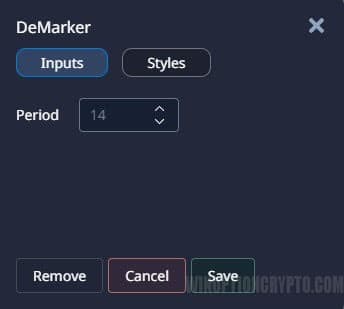
DeMarker
DeMarker's algorithm is similar to Donchian Channel in that it compares past price extremes with current ones. Displayed in a separate panel below the chart, it indicates trend direction and overbought/oversold conditions.
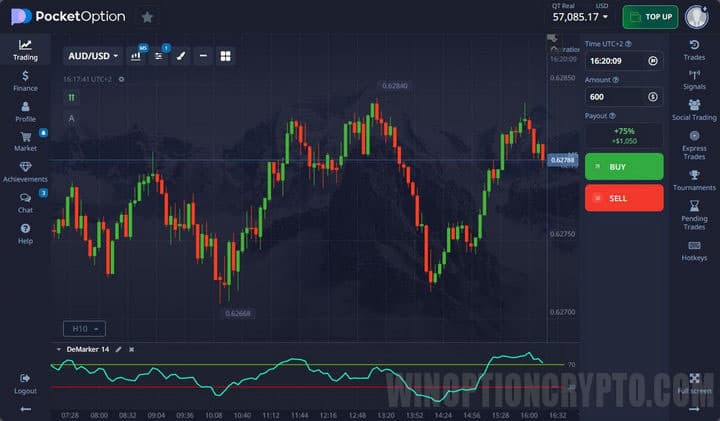
The calculation period can be adjusted in the settings:
Envelopes
Envelopes are based on the principle that price tends to revert to its typical range. When price breaks through a channel boundary, it is expected to return to the channel shortly afterward. Trades are taken both on breakouts and when price crosses the midline.
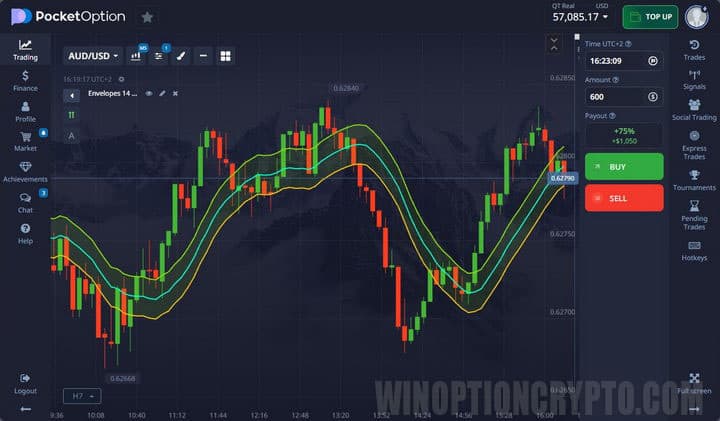
The channel bands can be configured in the settings:
.jpg)
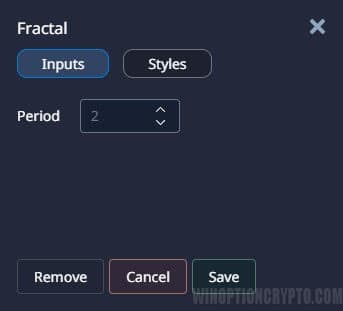
Fractals
The Fractals indicator is based on groups of five consecutive candles, where the middle candle (the third) represents the local high or low. The fractal marker appears directly above or below that candle.
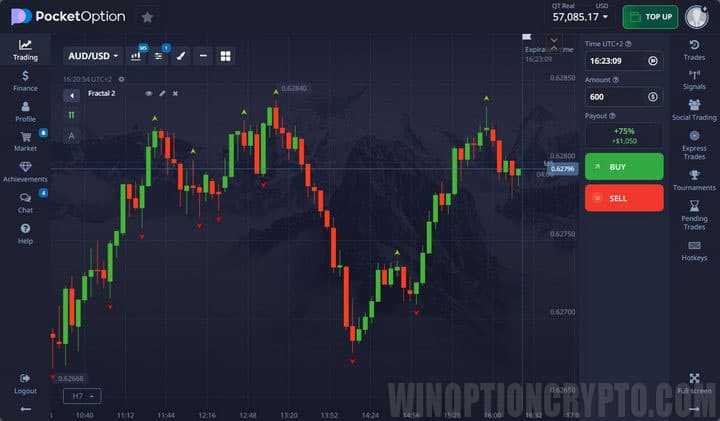
It is advisable to leave the default settings unchanged to preserve the standard construction logic:
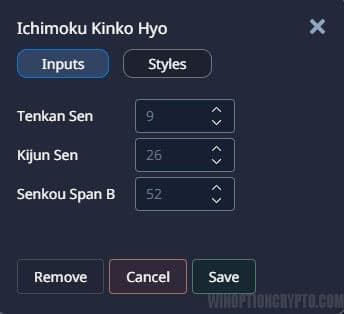
Ichimoku Kinko Hyo
A well-established indicator originally developed by a Japanese trader. Ichimoku helps identify the trend, support and resistance levels, and trade entry points. The tool consists of three lines and a cloud:
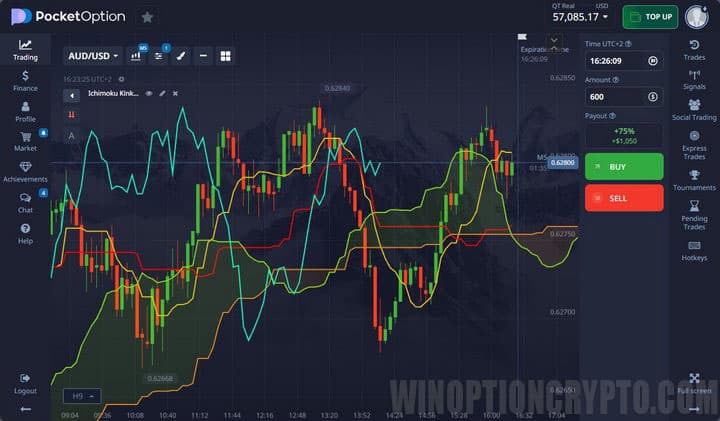
Line periods and colors can be customized:
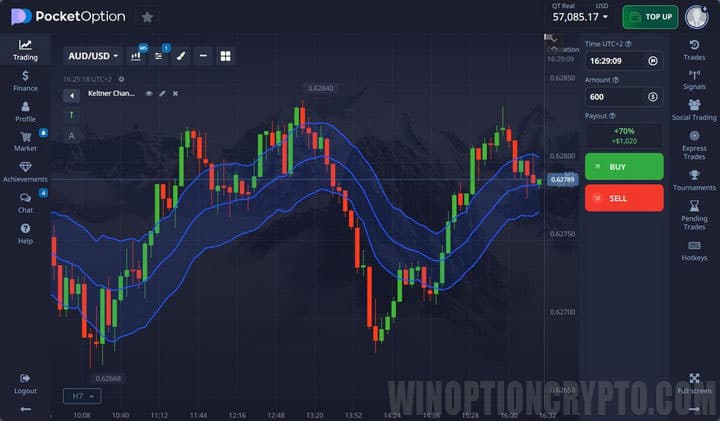
Keltner Channel
The Keltner Channel plots a simple moving average with a band above and below it, forming the channel. ATR is incorporated into the calculation. Breakouts of the channel boundaries signal a bullish or bearish trend:
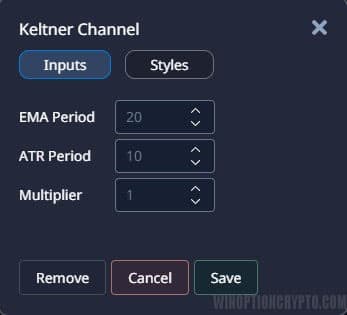
The moving average period and ATR settings can be adjusted:
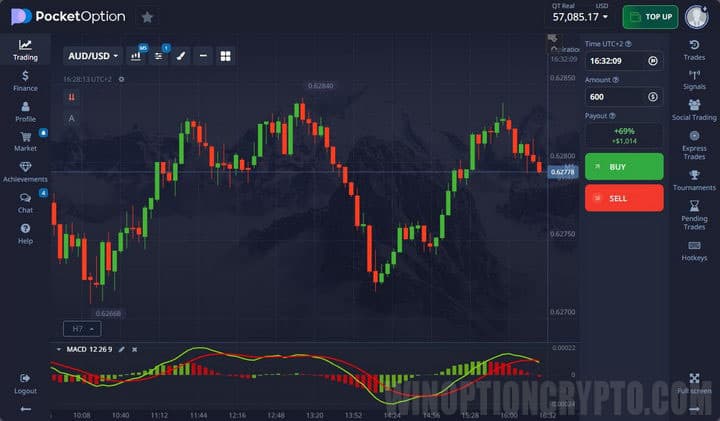
MACD
MACD is a trend-following oscillator based on two moving averages. The histogram grows when the moving averages diverge and shrinks when they converge, so histogram bars are tall during strong trends and short during ranging markets:
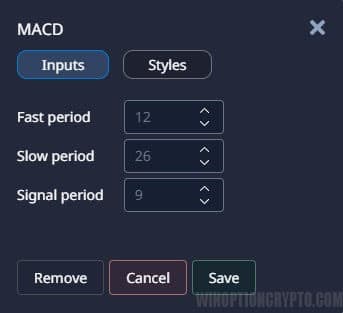
The periods of the fast and slow moving averages, as well as the signal line, can be configured:
Momentum
Momentum measures the magnitude of price change over a given period, making it a leading indicator. A Call signal appears when Momentum reaches its lows and begins to turn upward. A Put signal is generated when it turns downward from its highs:
.jpg)
The lookback period can be configured in the settings:

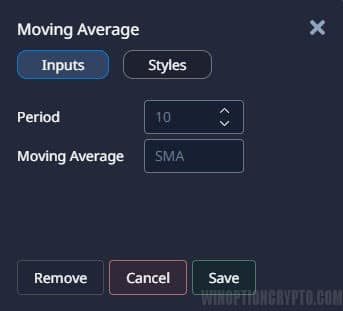
Moving Average
A Moving Average plots the average price over a selected time period, rising or falling in line with price. Several types of moving averages are available, each producing slightly different values; the simple moving average (SMA) is the most widely used:
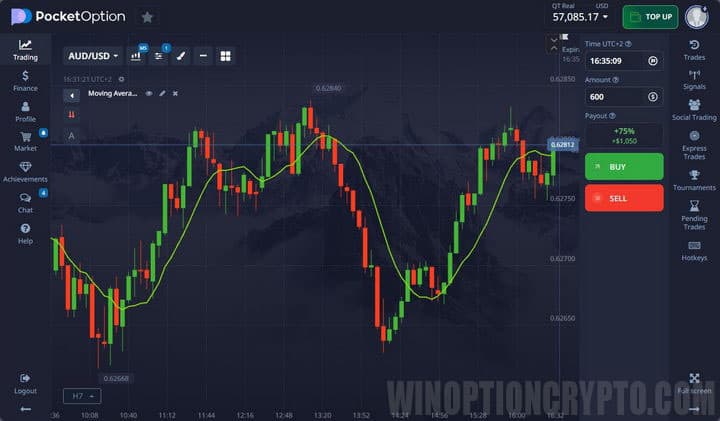
Both the period and the type of moving average can be configured:
OsMA
OsMA is a derivative of MACD that shows the difference between the MACD line and its signal line. When MACD is above its signal line, OsMA is above zero, and vice versa:
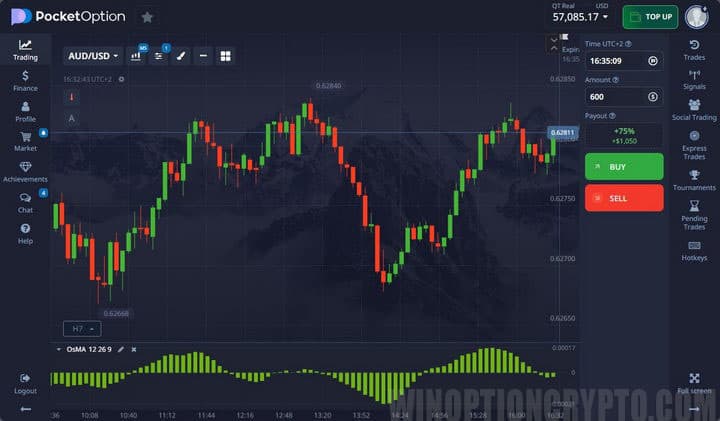
The settings are identical to those of MACD:
.jpg)
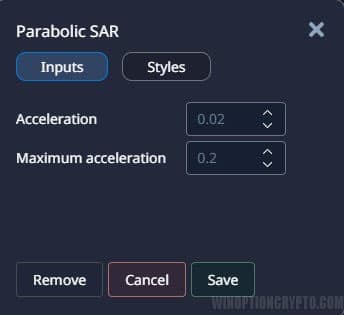
Parabolic SAR
Parabolic SAR is a trend indicator that signals trend reversals. It is calculated candle by candle using a step factor and an acceleration point. By default, the step factor is 0.02 — this value is added with each new candle close. The default acceleration point is 0.2:
.jpg)
Both values can be adjusted in the settings:
RSI
The Relative Strength Index (RSI) is a widely used indicator for identifying overbought and oversold conditions and spotting divergences. It is built by comparing two price measurements over the same period:
- downward price movement;
- upward price movement.
The result is an oscillator line plotted in a separate panel:
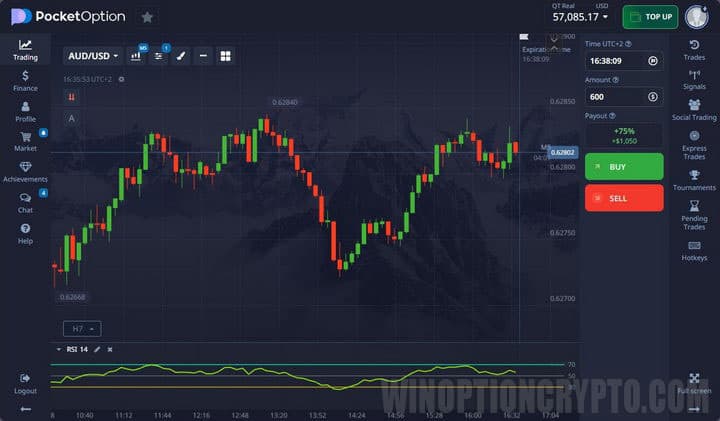
The calculation period can be adjusted in the settings:
.jpg)
Rate of Change
Rate of Change (RoC) shows the current relative strength of buyers and sellers. It functions similarly to Momentum, but uses 0 as its reference level rather than 100 and -100:
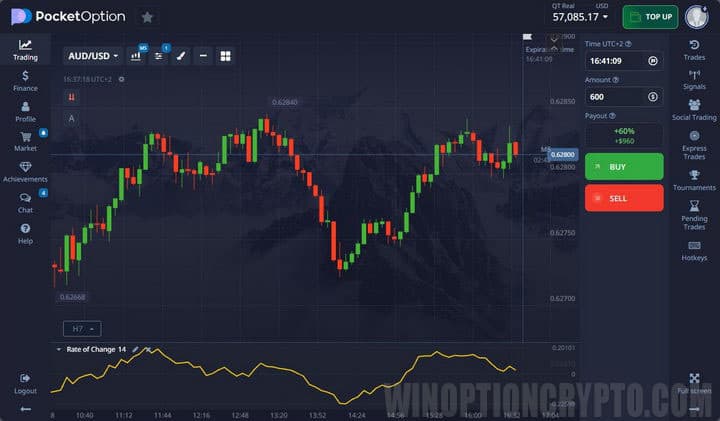
The lookback period can be changed in the settings:
.jpg)
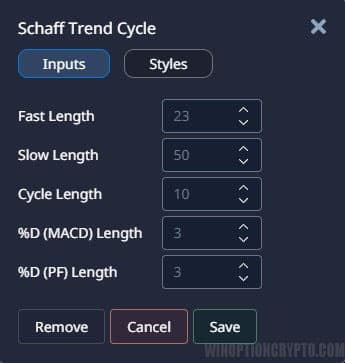
Schaff Trend Cycle
The Schaff Trend Cycle (STC) combines the logic of MACD and Stochastic. It first calculates the divergence between two EMAs (as MACD does), then applies the Stochastic algorithm to smooth those values:
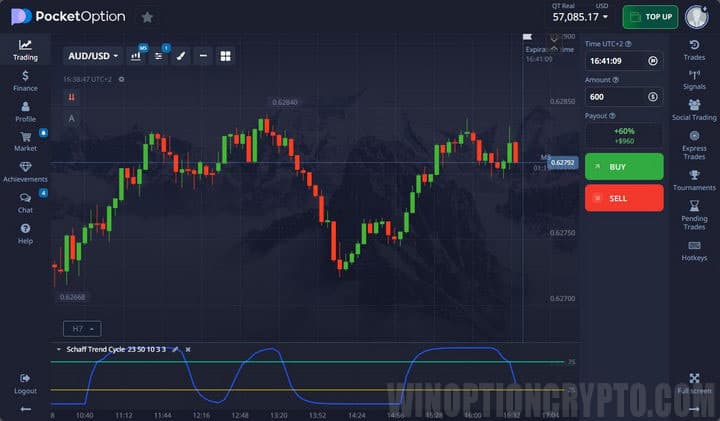
Multiple parameters can be adjusted in the settings:
Stochastic Oscillator
The Stochastic Oscillator is built using the highs and lows of closing prices to form its primary line. A second line is derived from the first, producing a responsive overbought/oversold indicator. Trades are taken either on exits from overbought/oversold zones or on divergences:
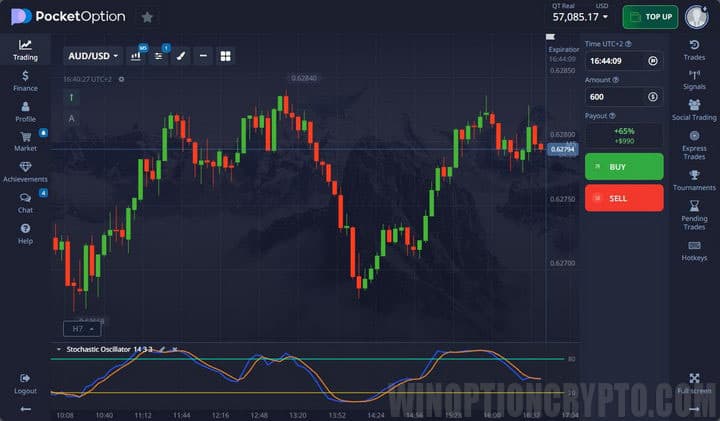
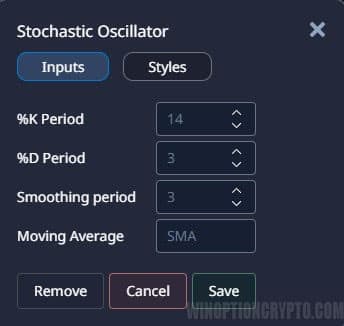
Periods, slowing, and the type of moving average can all be configured:
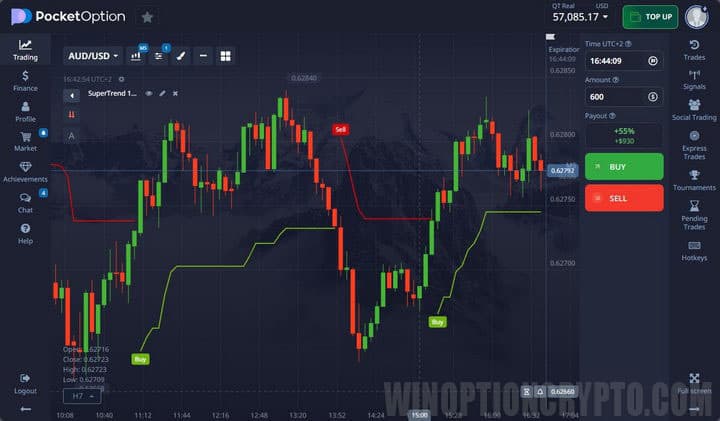
SuperTrend
SuperTrend is a trend identification tool; it is not intended for generating trade signals on its own. Its values are based on the closing price and incorporate ATR. During an uptrend, a green line labeled "Higher" is displayed; during a downtrend, a red line labeled "Below" appears:
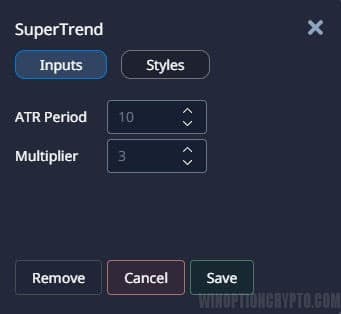
The ATR period and multiplier can be adjusted in the settings:
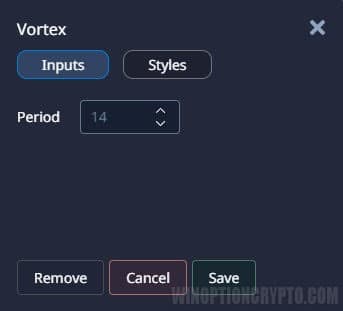
Vortex
The Vortex indicator consists of two lines — one tracking upward movement and one tracking downward movement. A signal is generated when the lines cross. When the green line crosses the red from below, a Call is taken; when the green crosses the red from above, a Put is taken:
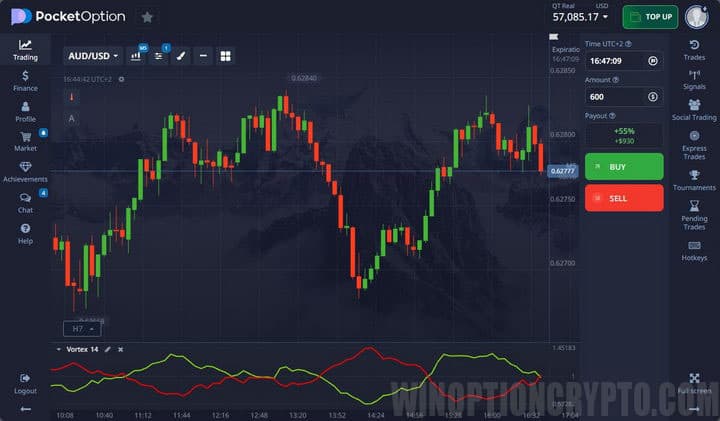
The period for calculating indicator values can be adjusted:
Williams %R
Williams %R works similarly to Stochastic: it compares the period's high with the closing price and multiplies the result by -100. Trade signals are generated on overbought/oversold crossings and divergences:
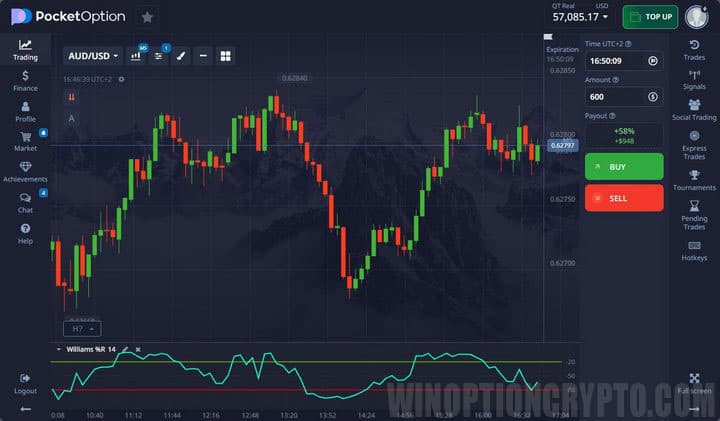
The period can be adjusted in the settings:

Zig Zag
Zig Zag is a trend indicator used not for generating signals but for identifying the prevailing price direction. It connects price extremes by filtering out minor fluctuations and market noise:
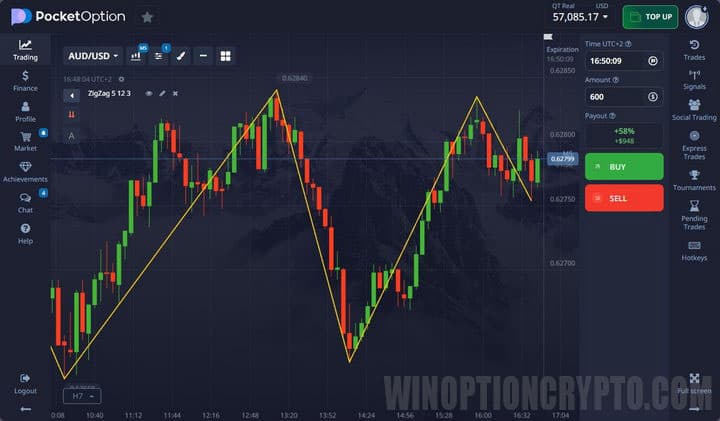
Deviation, calculation depth, and backstep can all be configured:
.jpg)
Examples of Using Pocket Option Indicators
When configuring an indicator for binary options trading, keep in mind that sensitivity and lag need to be balanced carefully. Using indicators in combination tends to produce more reliable signals.
For example, Vortex, ADX, or MACD can be used together in binary options trading. These tools complement each other by accounting for both price momentum and volatility or trend direction. The crossover point on the chart can be marked with a vertical line for reference:
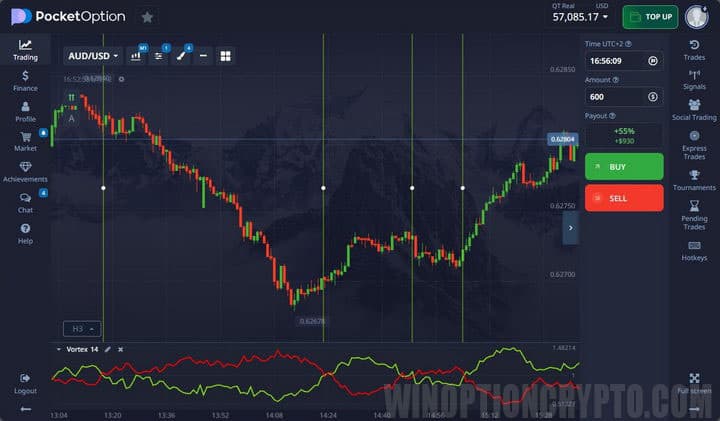
Signals generated within a chosen binary options strategy are interpreted using standard rules. However, it is recommended to open orders while also accounting for the likely magnitude of the anticipated price move.
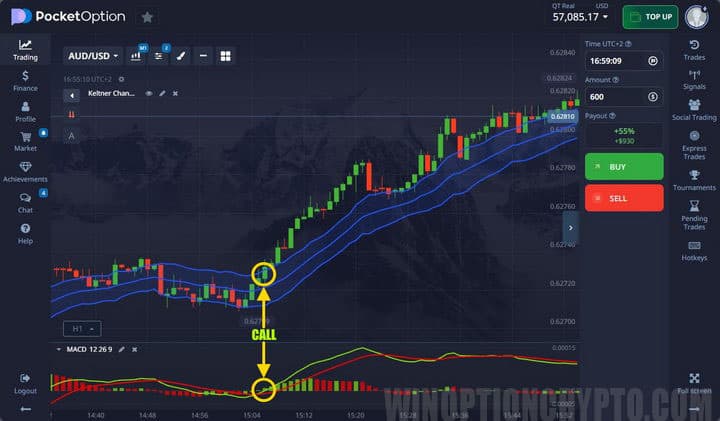
The screenshot below shows an example of buying a Put contract using the Keltner Channel in combination with a trend oscillator. The first signal appears when price re-enters the channel from below; the second is confirmed by MACD, which validates the direction of price movement:
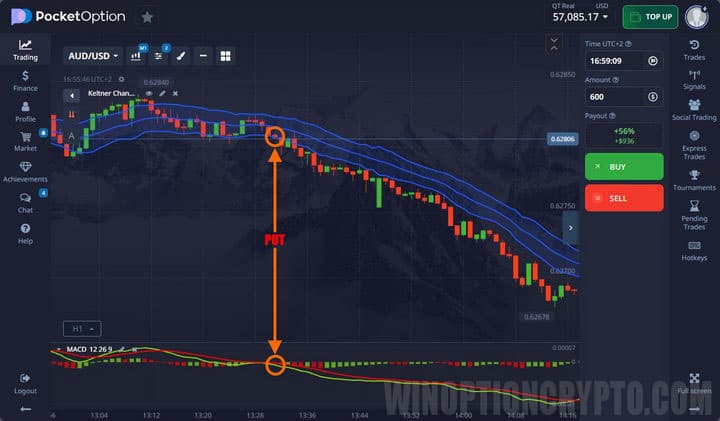
The following screenshot shows an example of a successful Put contract using a similar setup:
For a broader view of market conditions, traders may also monitor charts in a Forex terminal such as MetaTrader 4. That said, Pocket Option provides all the tools needed to trade effectively without relying on third-party platforms.
START TRADING WITH POCKET OPTION

To leave a comment, you must register or log in to your account.