The ADX indicator — also known as the Average Directional Index or Directional Movement Index — is one of the most widely used technical indicators in the Forex market. First described by J. Wells Wilder Jr. in 1978, it has undergone only minor refinements over its nearly fifty-year history while retaining its distinctive approach.
What makes this indicator unique is that it can legitimately be called a trend oscillator — meaning it is capable of not only identifying the direction of a trend, but also measuring its strength with a reasonable degree of accuracy.
That said, traders — particularly beginners — should be aware that relying on this tool as a standalone, self-sufficient system carries significant risk. Many experienced analysts consider this approach inadvisable.

Description of the ADX Indicator
The ADX indicator is available on almost all trading platforms, though it requires some explanation to use effectively. It consists of three lines:
- +DI — positive directional indicator;
- -DI — negative directional indicator;
- ADX line — the average directional line, calculated from the two lines above.
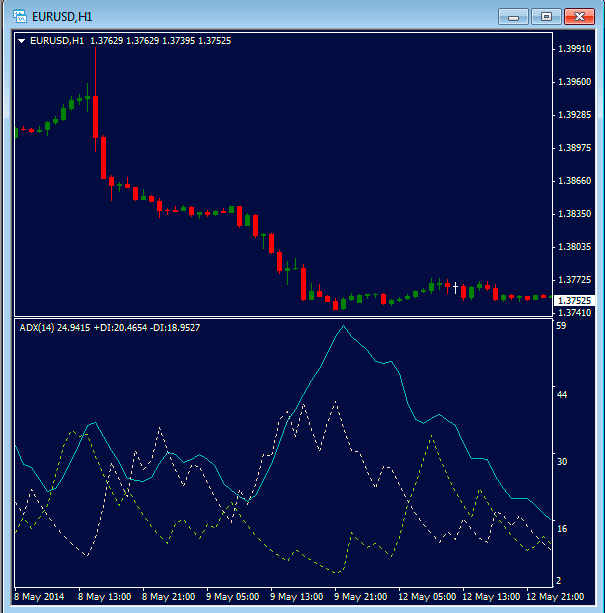
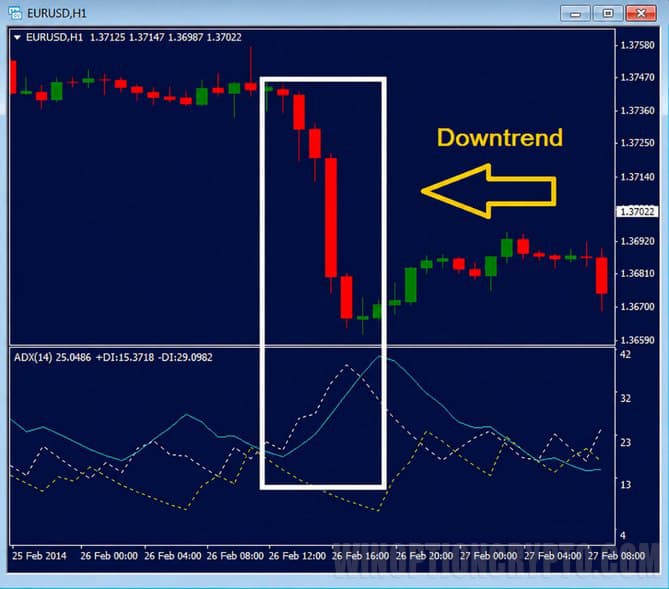
All three lines move within a range bounded by 0 and 100, and each carries meaningful information. The ADX line indicates whether a prevailing trend is present in the market: when it points upward, a trend is developing; when it moves sideways or downward, no clear trend is present.
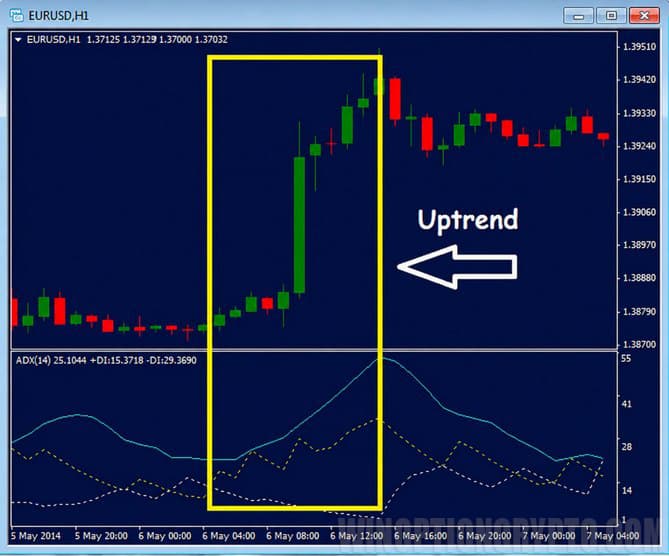
The +DI and -DI lines show which side currently dominates the market. When +DI is above -DI, bullish sentiment prevails. When +DI is below -DI, bearish sentiment dominates.
The indicator operates between 0 and 100, but in practice it rarely rises above 60. A reading above 40 indicates a strong trend; a reading below 20 suggests the market is essentially trendless.
A wide gap between the +DI and -DI lines provides additional confirmation that a trend is in place. Conversely, when the lines converge, this signals that trend momentum is weakening.

ADX Indicator Settings
Instructions for installing indicators in MetaTrader 4:
The indicator is straightforward to set up. A trader needs to configure two parameters:
- Period;
- Price.
The price setting is simple — any price type can technically be used, but the developers recommend closing prices.
The period requires a little more consideration. The default is 14 bars, though various sources suggest values ranging from 7 to 30 bars.
When selecting a period, keep the following trade-offs in mind:
- Increasing the period makes the ADX smoother and reduces noise, but also slows its response — the trader risks entering a move too late, which can significantly affect profitability.
- A shorter period makes the indicator more responsive but generates a higher number of false signals for binary options, which reduces its reliability.
Conclusions
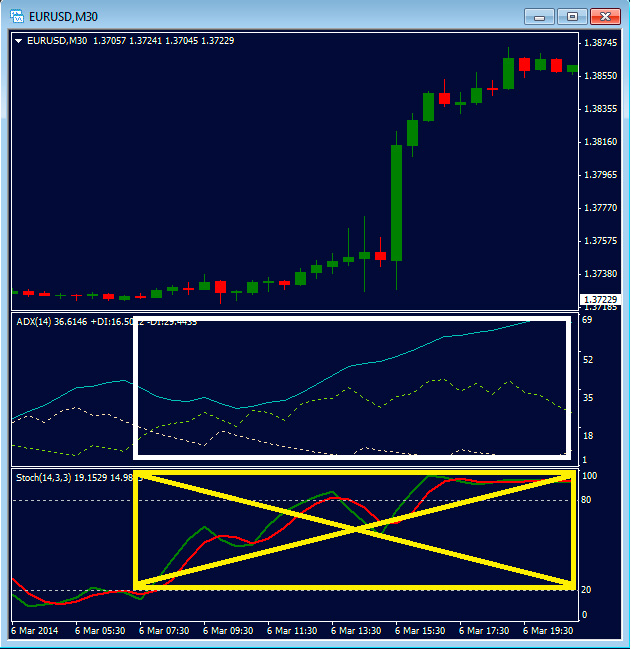
The ADX indicator is multifaceted, and a single article cannot cover all of its nuances. The most important principle to understand about the Directional Movement Index — and about technical indicators in general — is that a signal from a single source is not a confirmed signal; it is simply one hypothesis. That hypothesis should be confirmed or ruled out using data from other indicators.
Download the ADX Indicator for Free
Not sure how this indicator works? Leave a comment below, and subscribe to our YouTube channel WinOptionCrypto — we'll answer your questions in upcoming videos.
See Also:
- How to make money on binary options
- Pros and cons of trading binary options
- How to make a profit by trading on clean charts
- How to adapt a Forex strategy to Binary Options?
To leave a comment, you must register or log in to your account.