The Traders Dynamic Index (TDI) binary options indicator is a powerful technical analysis tool that gives traders a comprehensive view of the market, covering trend direction, momentum strength, and volatility. This review explains how to use its signals effectively in binary options trading.
Contents:
- Key Features
- Installation
- Overview and Settings
- Trading Rules for the Traders Dynamic Index
- Specifics of Application
- Conclusion
- Download Traders Dynamic Index
Key Features of the Traders Dynamic Index Indicator
- Terminal: MetaTrader 4
- Timeframe: M5
- Expiration: 3 candles
- Option Types: Call/Put
- Built-in indicators: TradersDynamicIndex.ex4
- Trading instruments: currency pairs, commodities, cryptocurrencies, stocks
- Trading hours: 08:00–21:00 UTC
- Recommended brokers: Quotex, Pocket Option, Binarium
Installing the Traders Dynamic Index Binary Options Indicator
The Traders Dynamic Index indicator is installed on the MetaTrader 4 platform using the standard method. Add it to the terminal's root folder by opening the "File" menu in MetaTrader 4 and selecting "Open Data Folder." In the folder that opens, navigate to "MQL4" → "Indicators" and move all files there. Templates are installed the same way, but must be placed in the "templates" folder instead. For a full walkthrough, watch our video:
Traders Dynamic Index Indicator: Overview and Settings
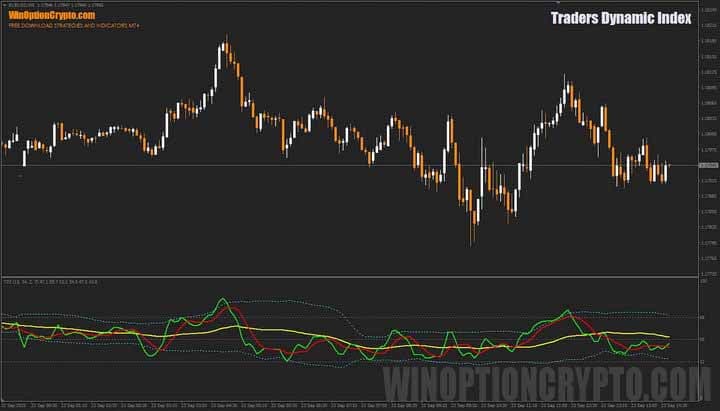
The Traders Dynamic Index (TDI) is a more advanced and multi-functional counterpart to the well-known RSI, built on the foundation of the Relative Strength Index. Unlike the standard RSI found in most trading platforms, the TDI also incorporates two moving averages — a simple moving average and an exponential moving average — to determine trend direction.
The indicator also features a volatility channel, similar in appearance to Bollinger Bands. It is used to assess price volatility and identify potential reversal points — exactly what binary options traders need.
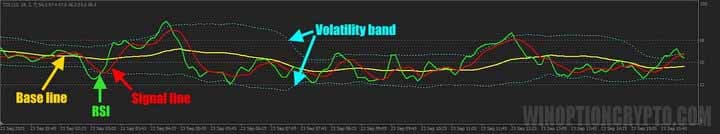
As the image above shows, the TDI consists of several lines displayed in the oscillator panel at the bottom of the chart. The green line, which acts as a fast moving average, represents the RSI calculated over the period set in the indicator's settings. The red line — the slow moving average, or signal line — indicates the direction of the medium-term trend. The yellow line, known as the base line, helps determine the overall trend. The blue dotted lines form the volatility channel, showing the range of price fluctuations for the asset being analysed.
The indicator has quite a few settings, which are worth reviewing before use.
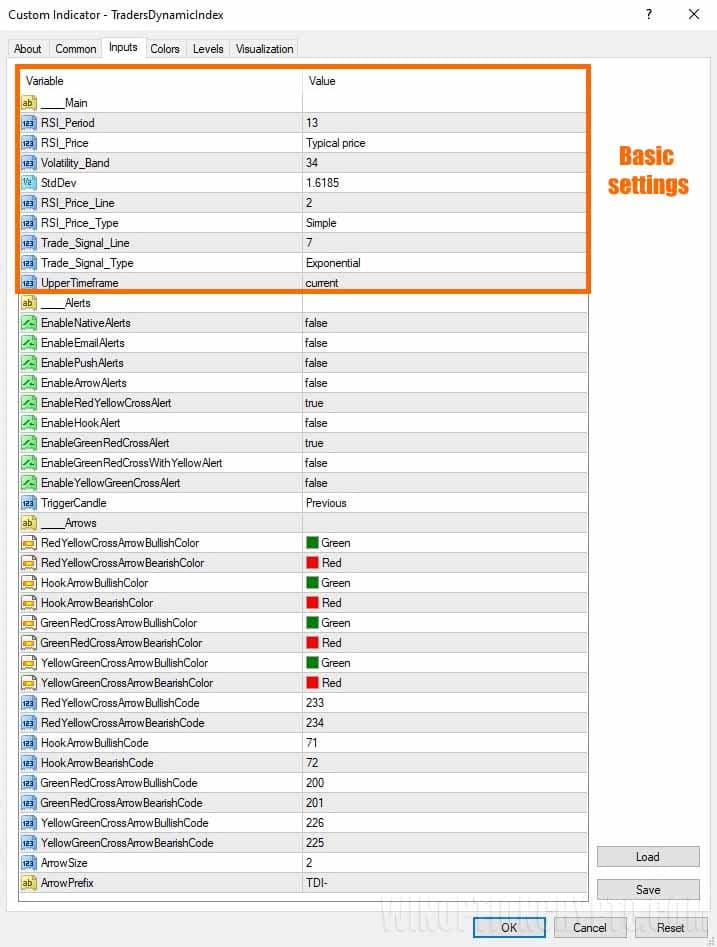
The most important settings are the calculation parameters for the main indicators and the alert options for moving average crossovers. Alerts can be enabled for crossovers of the red line with the yellow line, the green line with the red line, and the green line with the yellow line.
In the additional settings, the trader can adjust the size and colour of the signal arrows.
Trading Rules for the Traders Dynamic Index Indicator
There are several approaches to trading with this indicator: crossovers of the red and green lines, crossovers of the red and yellow lines, or the green line returning inside the volatility channel. The best approach depends on the asset and timeframe being used. In this review, we focus on trading with the volatility bands.
Price Action patterns, covered in our dedicated collection of articles, can further strengthen signals generated by this indicator:
- Price Action Binary Options
- Pattern indicators for MetaTrader 4
- Top 7 Patterns in Binary Options
Opening a Call Option
- Wait for the green line to cross the lower volatility band from below.
- At the opening of the next candle, buy a call option.
Opening a Put Option
- Wait for the green line to cross the upper volatility band from above.
- At the opening of the next candle, buy a put option.
We recommend setting the expiration time to three candles. The optimal holding period will vary by asset and should be determined through backtesting. This approach helps tailor the strategy to the chosen instrument and improve its overall effectiveness.
How to Use the Traders Dynamic Index Indicator Effectively
The key strength of this indicator is its comprehensiveness. Rather than using RSI, moving averages, and Bollinger Bands as separate tools, the Traders Dynamic Index combines their signals into a single, more complete market view. This allows traders to assess trend direction, momentum, and volatility simultaneously, simplifying the trading process considerably.
Advantages of the Traders Dynamic Index Indicator
The primary advantage of this indicator is that it delivers a broad range of market information and generates multiple entry signals. Traders can act on moving average crossovers, the green RSI line breaking outside the volatility bands, or divergences between price and the TDI — the latter providing an early warning of a potential trend reversal.
Disadvantages of the Traders Dynamic Index Indicator
The indicator's versatility can also be a drawback. The large number of lines and signals can overwhelm beginners, and signals based on moving averages tend to lag. In ranging markets, the tool can produce false signals. Additionally, the default settings are not suitable for all currency pairs and timeframes, so some experimentation on a demo account will be necessary.
Conclusion
The Traders Dynamic Index indicator is a versatile tool that, when used correctly, can meaningfully improve trading results. It gives traders a comprehensive view of the market by accounting for the current trend, price momentum, and volatility all at once. To get the most out of it, it is important to understand its underlying logic and to apply sound risk and money management at all times. We recommend starting with a demo account at a broker with a low minimum deposit. Good luck with your trading!
Download the Traders Dynamic Index Indicator

To leave a comment, you must register or log in to your account.