In any discussion of technical analysis, levels occupy a central place. They underpin many classic and modern chart patterns that traders use to identify recurring behavior in asset price movements.
There is a view that support and resistance levels cannot be adapted for binary options trading — in practice, this is not the case. The key is applying the right approach. Below we examine support and resistance levels as a standalone tool, cover their main advantages and limitations, and explain how to generate binary options signals from them.

What Are Support and Resistance Levels?
Support and resistance levels are psychological price barriers that price can only breach on the first attempt if the move is backed by strong momentum. They are also referred to as "key levels" — the two terms are interchangeable.
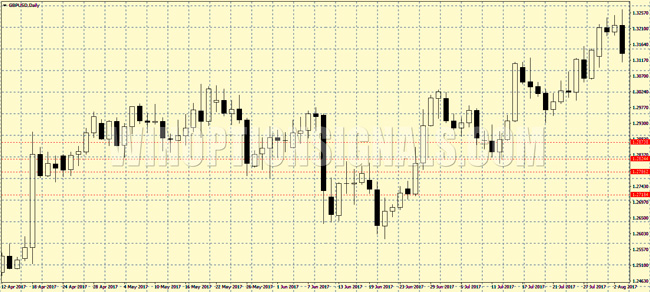
To identify a level on a price chart, look for multiple rejections from the same approximate price area. The clearest sign of a rejection is candles with prominent wicks at their extremes. The more rejections you can count, the more significant the level.
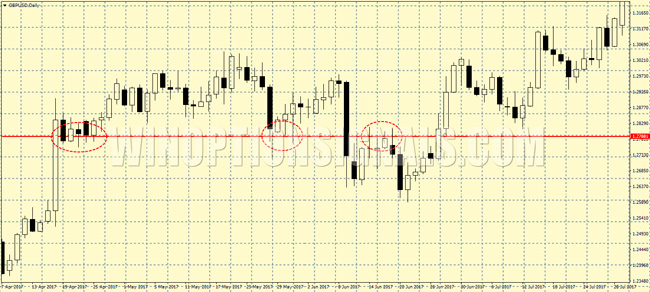
This method is straightforward but has a common pitfall: inexperienced traders tend to draw levels wherever they think they can see one, rather than where price has clearly reacted. Drawing lines on a chart is easy — identifying genuinely significant levels is a skill. For this reason, when first learning this approach, focus on the most prominent zones before attempting to mark every visible level.
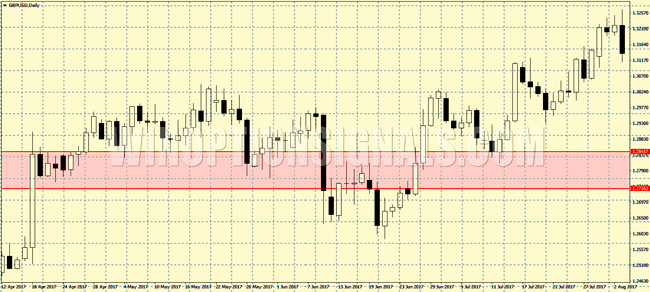
When multiple levels cluster together, outline the cluster as a zone rather than a single line. This zone acts as a buffer. If price enters it, treat that as a signal to stay out — it is too difficult to determine the likely direction until price exits the zone clearly. Trading zones this way reduces the impact of imprecise level placement and cuts down on false signals. The mechanics are slightly different from trading a single line, as described below.
Trading Strategy for Binary Options
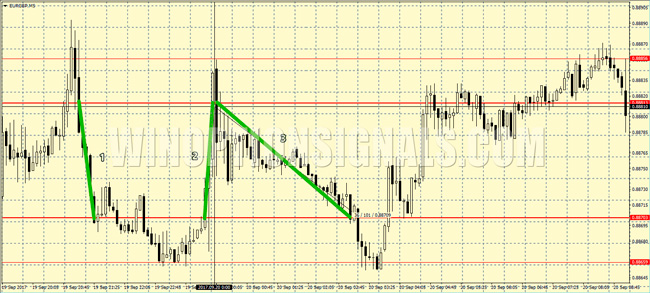
The strategy is based on a price channel defined by 3–4 extreme points, which are used to identify the outer support and resistance zones. The channel is divided into an outer layer and an inner channel — trading takes place within the inner channel. Short timeframes are recommended: intraday traders typically use M5 or M15.
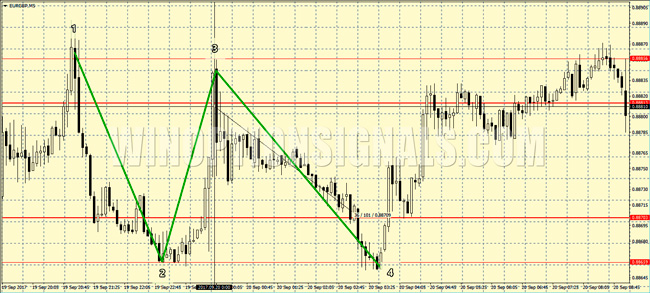
With four anchor points established, waves 1–2, 2–3, and 3–4 are visible on the chart. The next step is to count how many candles price takes to travel from one channel boundary to the opposite one for each wave, and then calculate the average.
In the example shown, the wave candle counts are 5, 3, and 36. Adding these and dividing by 3 gives an average of approximately 15 candles. This average becomes the expiration time to use when trading this particular channel.
Options are bought on confirmed rebounds from the channel boundary. When price touches the lower boundary, wait for confirmation: a candle that closes above it. This is the signal to open a Call option with an expiration of 15 candles. If price breaks through the boundary and continues to fall, open a safety trade for the same amount on the next touch of the same boundary — again with a 15-candle expiration.
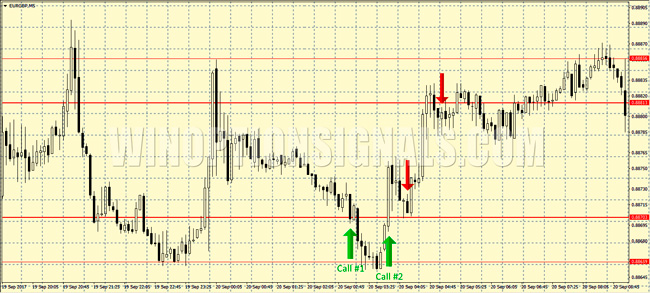
One advantage of binary options here is that the asset price only needs to be marginally higher at expiration than at the time of entry. Using the channel average as the expiration time means the probability of profiting on both the initial trade and the safety trade is reasonably high.
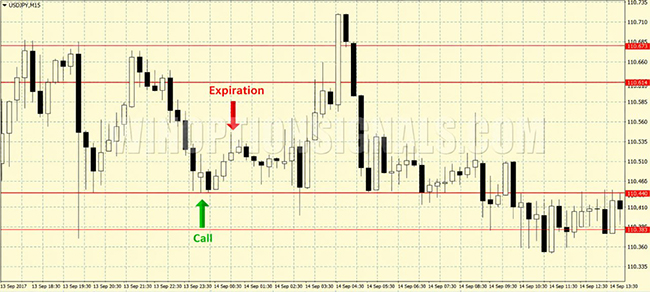
As a second example, consider an M15 chart of USD/JPY. This is a night-session channel, so price movement is contained. The average wave length works out to 4 candles — derived from the three preceding waves. On the M15 timeframe, this translates to a 1-hour expiration.
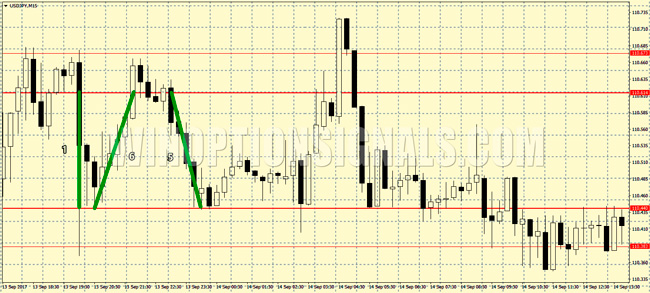
Buy an option when price touches the channel boundary and the candle closes beyond it. A second touch of the same boundary is a signal to open another trade in the same direction. When price touches the upper boundary, buy a Put option.
Conclusion
Beginners are advised to trade during the Asian trading session. Low volatility increases the probability of price rebounding from a level rather than breaking through it, making the market more predictable. Determining the expiration from the wave candle count is also more reliable when price moves are contained. If price breaks out of the channel, do not trade — switch to a different timeframe, a different asset, or redraw the channel to reflect current conditions.
Not sure how a particular strategy or indicator works? Leave a comment below, and subscribe to our YouTube channel WinOptionCrypto — we'll answer your questions in upcoming videos.
To leave a comment, you must register or log in to your account.