The Currency Slope Strength binary options indicator is an advanced tool for analyzing currency strength. Strategies based on assessing the relative strength of currency pairs have been attracting increasing interest from traders. To apply them effectively, traders need a tool that can quickly determine which of the two currencies in a pair is leading and which is lagging, and signal entries in the direction of the stronger one.
This is the principle the Currency Slope Strength indicator is built on. This review looks at how to use it in practice and how effective it is. The developers charge $85 for it — whether that price is justified is something we will assess together. A download link is available at the end of the article for those who want to test it themselves.
Contents:
- Key Features;
- Installation;
- Currency Slope Strength: Overview and Settings;
- Trading Rules;
- Opening a Call Option;
- Opening a Put Option;
- Conclusion;
- Download Currency Slope Strength.
Key Features of the Currency Slope Strength Indicator
- Terminal: MetaTrader 4;
- Timeframe: M15;
- Expiration: 4 candles;
- Option types: Call/Put;
- Indicators: currency-slope-strength.ex4;
- Trading instruments: currency pairs, commodities, cryptocurrencies, stocks;
- Trading hours: 08:00–21:00 UTC;
- Recommended brokers: Quotex, Pocket Option, Binarium.
Installing the Currency Slope Strength Binary Options Indicator
The Currency Slope Strength indicator is installed using the standard procedure in MetaTrader 4. Copy the indicator files to the terminal's root folder by selecting "File" in MT4, then "Open Data Folder". In the folder that opens, navigate to "MQL4" and then "Indicators", and place all the necessary files there. Templates are installed in the same way, but go into the "Templates" folder. For a full step-by-step walkthrough, see our video:
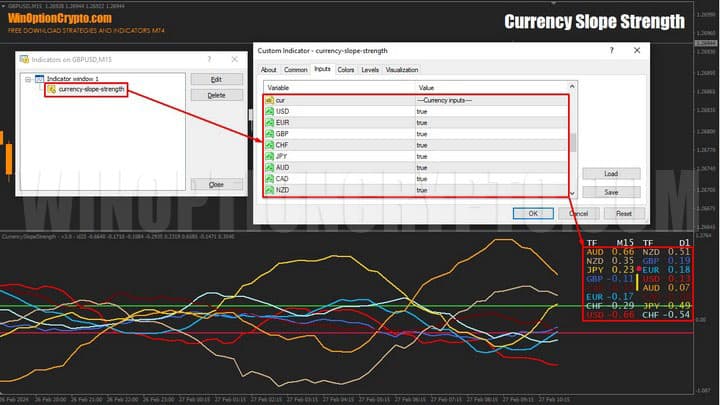
Currency Slope Strength Indicators: Overview and Settings
The Currency Slope Strength indicator helps identify the dominant currency in a pair. Based on this information, traders can form expectations about near-term price direction and the possible start of a new rally. The tool also handles current market phase assessment well — once you understand how it works, an emerging correction is hard to miss.
Several variants of this oscillator exist on the market. Although all are built on a similar principle, their calculation formulas differ. Some evaluate the rate of price change (ROC), others the relative strength index (RSI), and others the commodity channel index (CCI) or inter-market correlation (correlation).
As shown above, there are many approaches to building a relative currency strength index. The Currency Slope Strength indicator reviewed here is calculated using the Triangular Moving Average (TMA), which is similar to the simple moving average (SMA) but with additional smoothing applied.
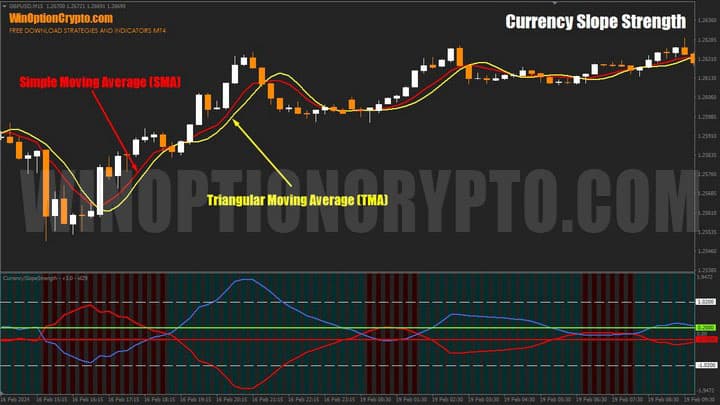
The chart above shows both moving averages with an averaging period of 7 bars. As you can clearly see, the Triangular Moving Average is smoother than its classic counterpart and lags slightly behind the SMA.
To measure currency strength, Currency Slope Strength evaluates the slope of the TMA. Rather than using standard TMA values directly, the indicator applies its own algorithm to reduce the lag typically associated with the Triangular Moving Average.
The indicator has a comprehensive set of settings, divided into four blocks:
- General Inputs — general settings;
- Indicator Inputs — indicator parameters;
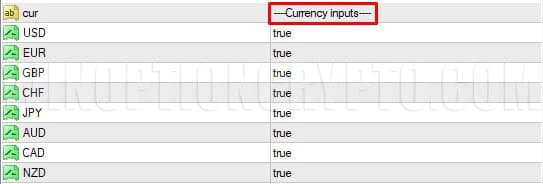
- Currency Inputs — selection of currencies for calculation;
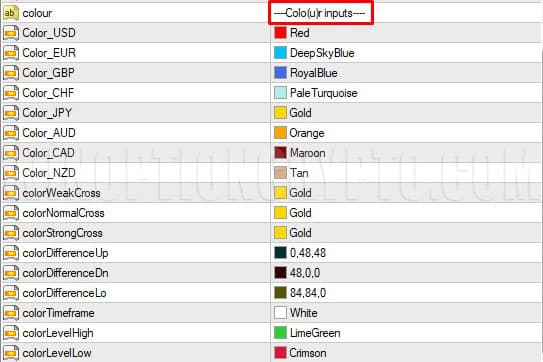
- Color Inputs — color settings for each currency's line.
Each of these is described in more detail below.
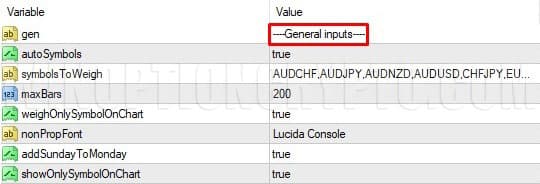
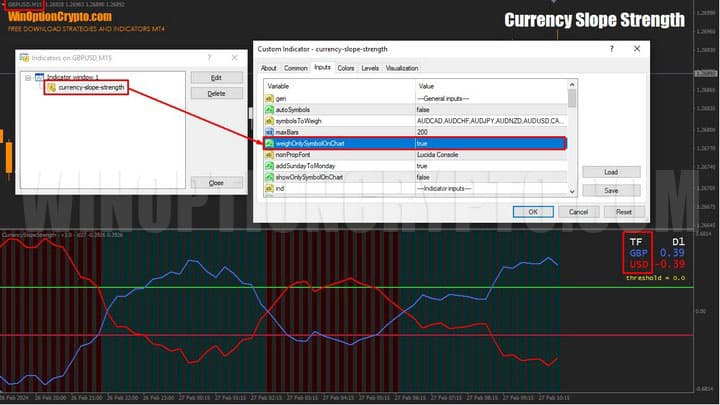
General Settings
In this section, the user can define the symbols used to calculate relative strength, set the maximum number of bars displayed by the oscillator, enable or disable weighting by the chart symbol only or by all currencies in the "Currency Inputs" block, configure fonts, add or remove weekend data points, and display only the dynamics of the currencies in the current chart's pair.
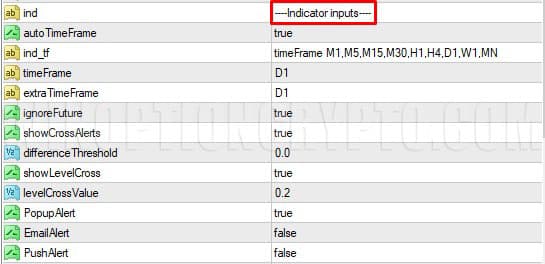
Indicator Parameters
This section allows the user to set the calculation timeframe, define the minimum threshold for triggering a signal when relative strength indices cross, and manage notifications — including pop-up alerts in the MetaTrader 4 terminal, email notifications, and push messages.
Selecting Currencies for Analysis
In this block, select the currencies whose relative strength will be calculated.
Display Settings
Here you can configure the appearance of the currency lines, including timeframe, crossover markers, and background color.
Operating Modes
The indicator has two operating modes:
- Displays all currencies enabled for analysis;
- Displays only the two currencies that make up the pair on the attached chart.
Here is how each mode works.
In Mode 1, the sub-chart panel shows indices for all currencies where "true" is set in the "Currency Inputs" block:
To enable this mode, set the "weightOnlySymbolOnChart" parameter to false.
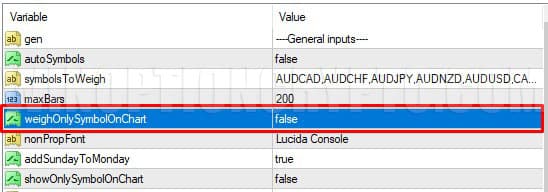
For Mode 2, to display only the currencies that make up the current chart's pair, set the "weightOnlySymbolOnChart" parameter to true:
Types of Signals
Currency Slope Strength generates three types of signals:
- Line crossover;
- Parallel index movement;
- Channel boundary break.
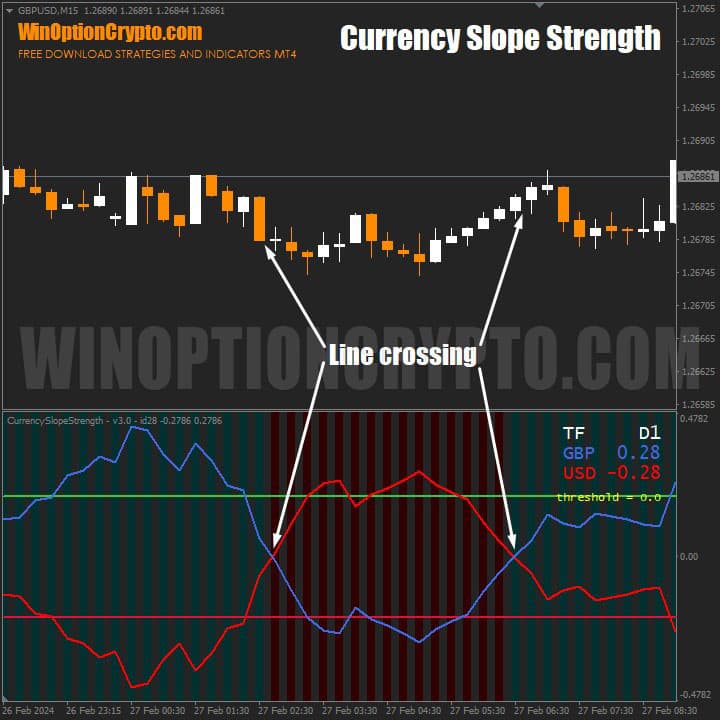
Line Crossover
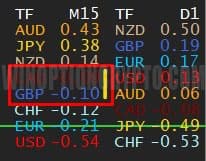
When the oscillator's curves cross, this signals a trend change. A vertical yellow stripe appears in the quotes panel.
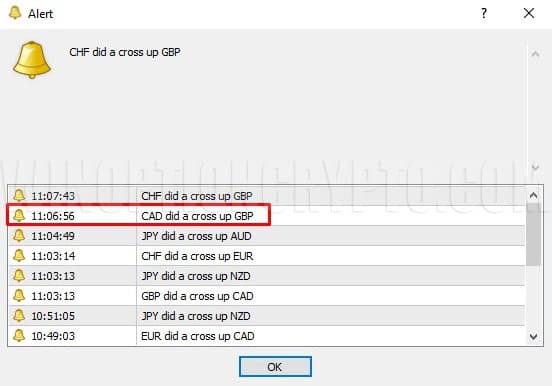
A standard MT4 pop-up alert also appears, indicating the direction of the crossover.
When the lines cross near the zero mark inside the channel, neither currency in the pair has yet built sufficient momentum for a sustained move higher or lower. A signal of this type alone should not be the basis for expecting a large profit — though it may precede the formation of a strong trend. The best approach in this situation is to wait for confirmation.
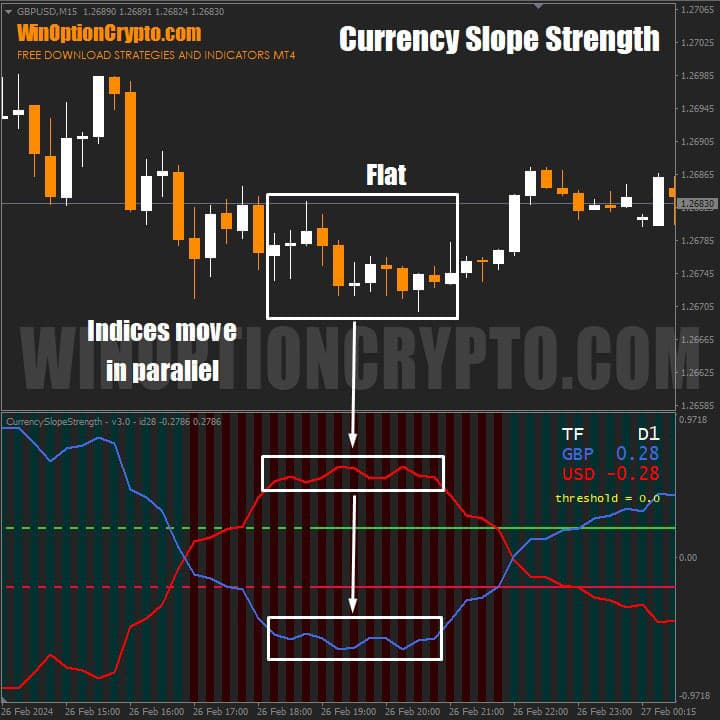
Parallel Index Movement
When both relative strength indices move parallel to each other, this indicates the onset of a ranging market. If neither currency in the pair is leading, it means traders have temporarily lost interest in the instrument — which is what this oscillator behavior reflects.
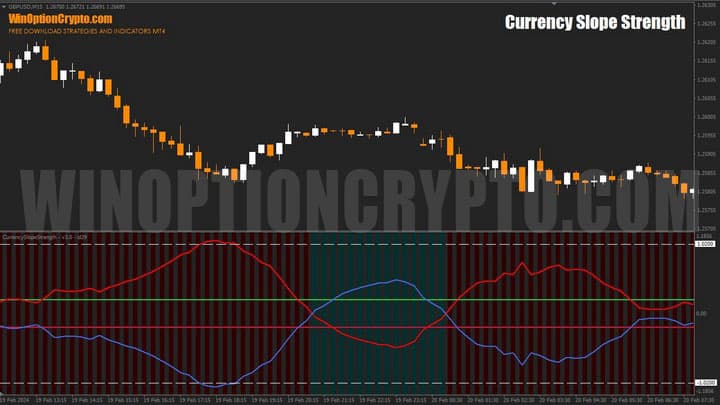
Channel Boundary Break
One of the strongest signals this oscillator produces is when both indices break beyond the channel boundaries defined by the "LevelCrossValue" parameter. The default value is 0.2, but we recommend calibrating it for each currency pair individually.
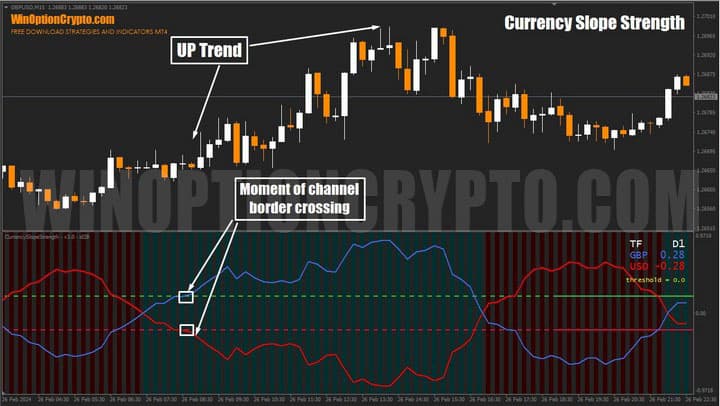
When both lines break out of the channel, one currency begins to slow while the other accelerates. This is typically a sign of a new trend and a good opportunity to enter a trade. The ideal setup is when one currency breaks through the upper channel boundary while the other breaks through the lower one — after such a signal, a sustained directional move typically follows.
Note that the indices do not always break both boundaries simultaneously. Sometimes one lags by one, two, or more bars. Even so, this is potentially a strong entry point for options trades or Forex positions. Crossing the +0.2/−0.2 levels is one of the indicator's primary signals.
Currency Slope Strength Trading Rules
Currency Slope Strength is a valuable tool for traders who prefer to trade the stronger side of a pair. It makes it straightforward to identify the leading currency and plan trades accordingly.
That said, even with this advanced analytical tool, we recommend grounding your approach in the principles of trend trading. The following articles on our website provide a solid foundation:
- How does a trend work in the markets?
- Identifying and using bullish and bearish trends.
- Market phase changes.
- How to identify a flat market.
The recommended expiration time for binary options trading is 3–5 candles, depending on the instrument. For any specific currency pair, the expiration should be determined through backtesting on historical data for the relevant timeframe.
Opening a Call Option
- The blue line crosses the green horizontal line of the sub-chart oscillator upward.
- The red line of the sub-chart oscillator crosses the red horizontal line downward.
- Buy a Call option at the opening of the next candle.
At candle close, the blue oscillator line breaks through the upper channel boundary and the red line breaks through the lower boundary — signaling a new bullish impulse. Open a Call at the start of the next candle.
Opening a Put Option
- The red line crosses the green horizontal line of the sub-chart oscillator upward.
- The blue line of the sub-chart oscillator crosses the red horizontal line downward.
- Buy a Put option at the opening of the next candle.
At candle close, the red oscillator line breaks through the upper channel boundary and the blue line breaks through the lower boundary — signaling a new bearish impulse. Open a Put at the start of the next candle.
Conclusion
Used correctly, Currency Slope Strength has every potential to become a core trading tool. It allows traders to evaluate currency pair dynamics at an early stage of trend formation. At $85, it is worth the price — and it can be applied effectively to both scalping and swing trading, in combination with other trend indicators.
This currency strength indicator is recommended for both beginners and experienced traders who want to add a tool for identifying the most promising currency pairs to their trading strategy. It helps assess which pairs offer the best trading opportunities at any given time. It also complements both technical and fundamental analysis approaches. As always, before trading on a live account with a reliable broker, practice on a demo account and apply sound money management and risk management principles.
Download Currency Slope Strength

To leave a comment, you must register or log in to your account.