The Triangular Moving Average (TMA) is a channel indicator that works across various timeframes without repainting. It is built on the basis of moving averages. The indicator is relatively new, so MetaTrader developers have not yet included it in their default toolkit — however, TMA is available as a free download.
What sets TMA apart from similar tools is its use of double-smoothed moving averages to estimate probabilities. This allows traders to identify the current trend direction more accurately. It also makes the indicator less sensitive to false signals.
Due to TMA's popularity, numerous modified versions have appeared online. Some of these allow traders to develop new strategies for binary options trading. One worth highlighting is the RSI TMA Centered Bands modification, which is discussed in detail below.
Instructions for installing indicators in MetaTrader 4:
Trading Conditions
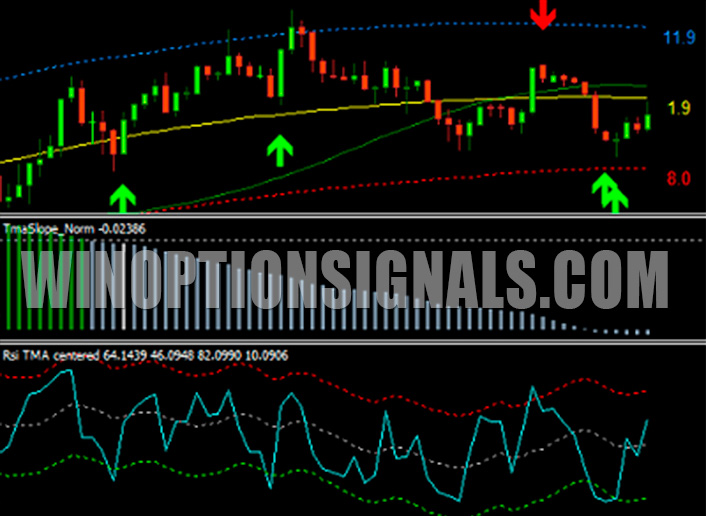
RSI TMA Centered Bands is a hybrid tool that combines the features of the TMA channel indicator with an RSI oscillator. The combination works well, as it allows traders to assess two things simultaneously:
- the probability of a trend reversal to the upside or downside;
- whether the selected asset is overbought or oversold.
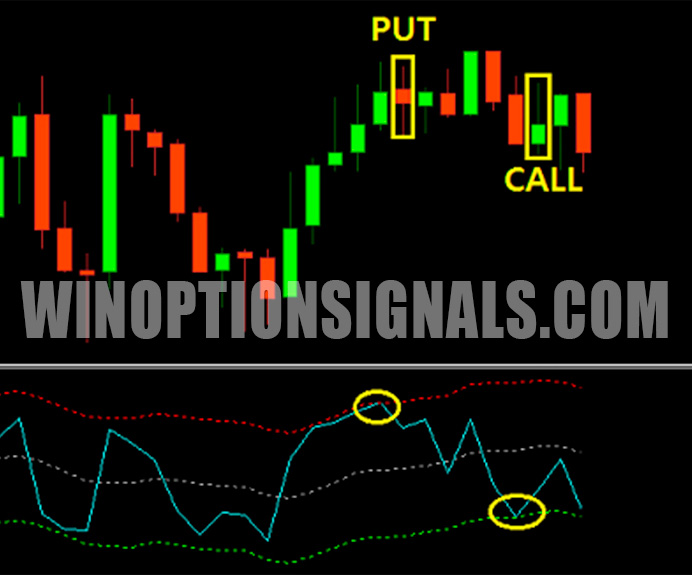
The indicator signals an imminent bullish reversal when the oscillator line rises above the central TMA line. A likely drop in the asset's value is indicated when the RSI falls below the TMA line.
In addition, an asset is considered overbought when the RSI line is above the upper TMA band, and oversold when the RSI line is below the lower TMA band.
This modification uses an oscillator with a short period — the default value is 3. For this reason, it is not recommended to apply RSI TMA Centered Bands to trades with an expiration of more than two candles.
Using Additional Filters
RSI TMA Centered Bands includes two built-in filters that balance each other's signals. Even so, it is advisable to confirm binary options signals with additional tools. One effective combination is to pair RSI TMA Centered Bands with Keltner Channels.
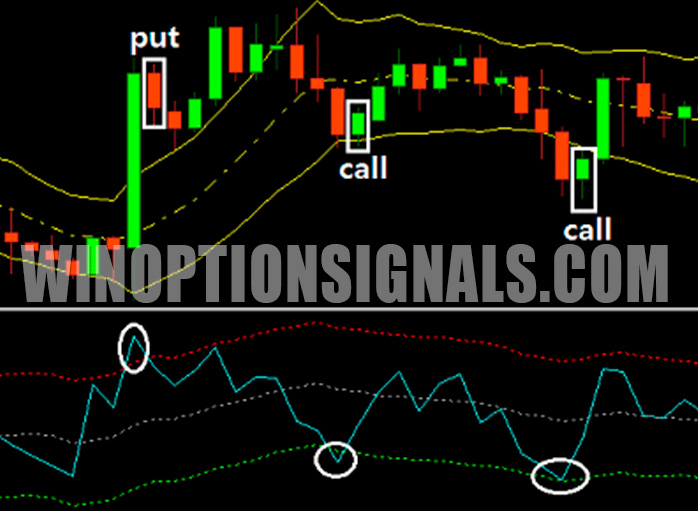
When using this combination, two conditions must be met simultaneously before buying a Put option:
- the RSI line is above the upper TMA band;
- the current price has risen above the upper Keltner Channel band.
To buy a Call option, wait for the opposite conditions:
- RSI has dropped below the lower TMA band;
- the price is below the lower Keltner Channel band.
When using this combination, pay attention to reversal candlestick patterns. It is also advisable to avoid trading during periods of high volatility driven by news releases.
TMA is widely regarded as a useful tool among traders and can be applied across a range of strategies. That said, no indicator can fully protect a trader from losing trades. TMA should therefore always be used alongside other market analysis tools.
Download the RSI-TMA Indicator |
Download the RSI-TMA-Arrows Indicator |
Not sure how a particular strategy or indicator works? Leave a comment below, and subscribe to our YouTube channel WinOptionCrypto — we'll answer your questions in upcoming videos.

See Also:
- How to Make Money on Binary Options
- Pros and Cons of Trading Binary Options
- How to Make a Profit by Trading on Clean Charts
- How to Adapt a Forex Strategy to Binary Options
To leave a comment, you must register or log in to your account.