The Pocket Option "Vortex" binary options strategy is based on a combination of two popular technical analysis indicators. Together, they allow traders to identify the start of a new trend early and confirm the direction of an existing one. This method is well suited to active binary options trading, as it effectively filters out market noise and keeps the focus on strong price movements. In this article, we explain how to use the system's signals correctly to get the best results.
Contents:
Key Features of the Pocket Option "Vortex" Binary Options Strategy
- Terminal: Webtrader Pocket Option
- Timeframe: M5
- Expiration: 2 candles
- Option Types: Call/Put
- Built-in indicators: Vortex (5), EMA (21)
- Trading instruments: currency pairs, commodities, cryptocurrencies, stocks
- Trading hours: 08:00–21:00 UTC
- Recommended brokers: Pocket Option
Installing the Pocket Option "Vortex" Binary Options Strategy
The indicators for the Pocket Option "Vortex" strategy are added in the standard way. Open the main trading platform window, click the "Indicators" icon, and navigate to the indicator selection menu. Find the desired tool in the list and configure its parameters.
Pocket Option "Vortex" Binary Options Strategy: Overview and Settings
The foundation of this trading system is the Vortex indicator — a name that translates as "whirlwind." It is a relatively recent technical analysis tool designed to identify the start of a new trend and confirm the direction of an existing one.
Its origin story is notable: two traders, Etienne Botes and Douglas Sipman, set out to apply the ideas of Austrian inventor Viktor Schauberger, who had studied vortex flows in water, to financial markets. They hypothesized that similar cyclical patterns could be observed in price behavior.
The development of the Vortex indicator was also influenced by the "Directional Movement" concept introduced by J. Welles Wilder, the creator of the well-known ADX and RSI. The indicator was first published in January 2010 in the journal Technical Analysis of Stocks & Commodities.
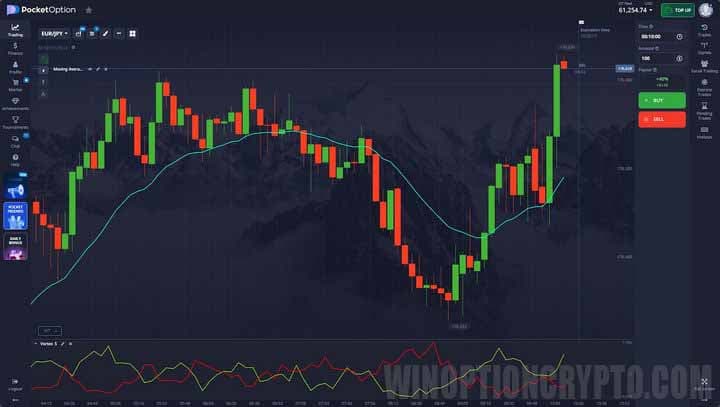
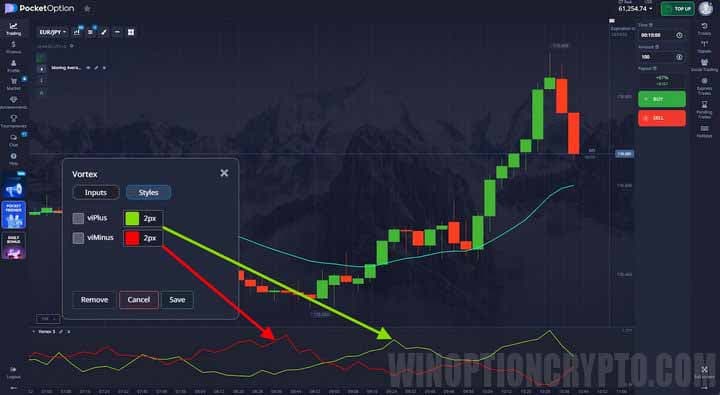
The indicator consists of two lines plotted below the price chart:
- VI+ (viPlus) — a positive vortex line that measures upward price movement;
- VI− (viMinus) — a negative vortex line that measures downward price movement.
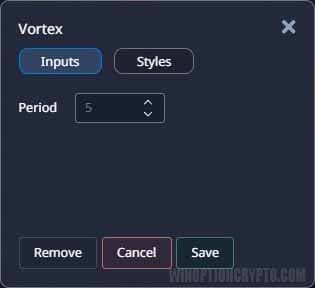
The calculation period can be set in the indicator settings. The default is 14, but for binary options trading on the five-minute timeframe, a value of 5 is considered optimal.
Signals are generated when the two lines cross.
When the green VI+ line crosses the red VI− line from below, this is a signal to buy a Call option (or open a long position on Forex). The reverse crossover triggers a sell signal on Forex or a Put option signal for binary options.
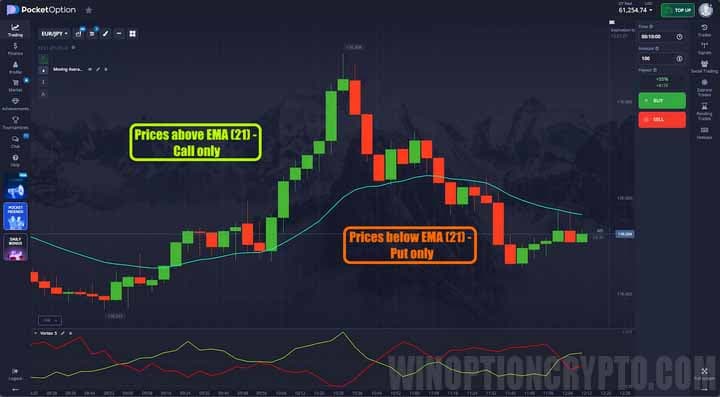
However, the Vortex indicator can generate false signals. To reduce their impact and improve accuracy, the strategy incorporates a secondary filter: an exponential moving average (EMA) with a period of 21. Under the strategy's rules, Call trades are only opened when candles close above EMA(21), and Put options are only opened when candles close below it.
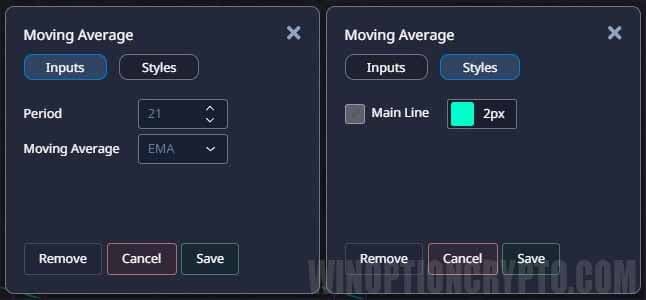
The moving average is straightforward to configure. Traders can set the calculation period, select the type — simple, exponential, weighted, or smoothed — and customize the line color and thickness.
Trading Rules for the Pocket Option "Vortex" Strategy
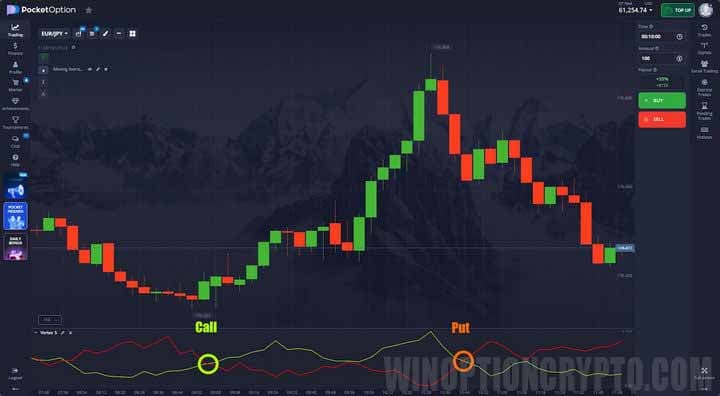
First, determine the direction of the current trend by observing where candles are closing relative to EMA(21). Candles closing above the EMA indicate a bullish market; candles closing below indicate a bearish one.
Next, check the Vortex indicator: VI+ should be above VI− in an uptrend, and below it in a downtrend.
Once both conditions are met, wait for the entry pattern: to open a Call option, the last candle must close above the previous candle's high; to open a Put option, it must close below the previous candle's low.
To learn more about candlestick patterns and how to apply them in binary options trading, see the following articles:
- Candlestick analysis and binary options.
- Japanese Candlesticks for Beginners and How to Read Them.
- Japanese candlesticks — graphical analysis.
- Using Pin Bars in Binary Options Trading.
Opening a Call Option
- Price is above EMA(21) — the market is in a bullish trend.
- The green VI+ line is above the red VI− line.
- The last candle closed above the previous candle's high.
- At the open of the next candle, buy a Call option.
Opening a Put Option
- Price is below EMA(21) — the market is in a bearish trend.
- The red VI− line is above the green VI+ line.
- The last candle closed below the previous candle's low.
- At the open of the next candle, buy a Put option.
Set the expiration time to two candles, though other periods can be tested.
Specifics of Using the Pocket Option "Vortex" Binary Options Strategy
The strategy's main indicator has several characteristics worth understanding before using it in live trading. Vortex allows traders not only to determine the preferred trading direction but also to gauge trend strength: the greater the distance between VI+ and VI−, the stronger and more stable the current trend. When the lines frequently cross or run nearly parallel, the market is likely in a flat.
Advantages of the Pocket Option "Vortex" Strategy
The main advantage is early identification of new trends. The Vortex indicator alerts traders to emerging price movements well before many classic technical indicators do. The system is also versatile — suitable not only for scalping on short timeframes but also for medium-term trading.
Cons of the Pocket Option "Vortex" Strategy
The main drawback is the tendency to generate false signals during flat market conditions. When price moves sideways, the Vortex lines cross frequently, producing unreliable entry points. Increasing the calculation period to filter these out introduces lag — meaning the signal for a new trend may arrive late, causing the trader to miss a significant portion of the move.
Conclusion
The Pocket Option "Vortex" binary options strategy brings together several proven technical analysis tools, each with a distinct role: the Vortex indicator and EMA(21) establish and confirm trading direction, while the candlestick pattern pinpoints the optimal moment to enter.
Despite its effectiveness, the Vortex indicator is considered relatively new and is not yet as established as classic tools like RSI, MACD, and Stochastic. Before trading with real funds, test this strategy on a demo account with Pocket Option. As always, apply sound risk and money management principles. Happy trading!
Having trouble understanding how this strategy or indicator works? Let us know in the comments below, and subscribe to our WinOptionCrypto YouTube channel — we answer all questions in our videos.

To leave a comment, you must register or log in to your account.