Japanese candlesticks are among the most popular chart types in binary options trading. They can support profitable trading without relying on additional strategies or indicators — the price chart itself is the primary tool.
This style of trading is made possible by candlestick patterns, which even beginners can learn to apply after studying the basics of candlestick analysis.

What Is Candlestick Analysis in Binary Options?
Candlestick charts have a long history in trading. The name "Japanese candlesticks" is no accident — this method of displaying prices was developed in Japan.
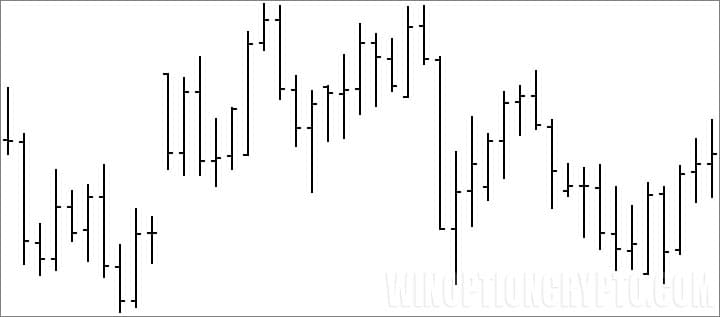
The Japanese trader Munehisa Homma was the first to use candlestick charts in trading. The rest of the world did not encounter this method until the late 20th century. Before candlestick charts, the bar chart was the dominant price display format:
In the West, candlestick charts were popularised by Steve Nison, an analyst at the American investment bank Merrill Lynch, through his book Japanese Candlestick Charting Techniques — one of the most widely read trading books of its era.
Candlestick analysis involves identifying patterns, which typically consist of two or three consecutive candles. Before studying the patterns themselves, it is worth understanding the basic structure of a candlestick:
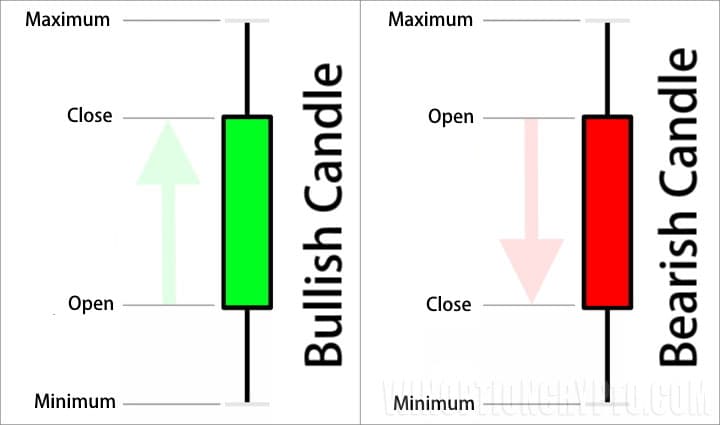
As shown above, each candle has a body (from open to close) and wicks (representing the period's price high and low). This structure is the same regardless of whether the candle closes up or down.
Individual Candles and Patterns in Candlestick Analysis
Candlestick analysis encompasses individual candle types, multi-candle patterns, and combinations of both. Candles may look similar to one another, but their meaning differs depending on context.
Beginners often find it difficult to spot the relevant formations at first. A useful aid is a Japanese candlestick indicator, which automatically identifies and marks many candle types directly on the chart.
Individual Candle Types
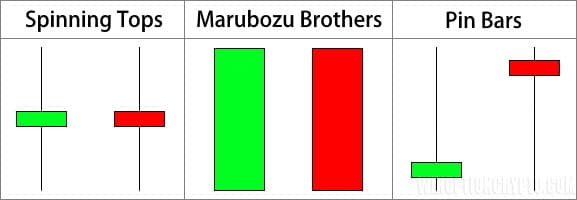
In candlestick analysis, the wicks deserve particular attention — they reveal the underlying sentiment of the market. Key observations:
-
Wicks of equal length. These indicate market indecision. When candles with balanced upper and lower wicks (spinning tops) appear, it is generally better to wait and observe how price develops before entering a trade.
-
A long wick on one side. When the upper wick is significantly longer than the lower, or vice versa (pin bars, hammers), this signals aggressive buying or selling. These formations indicate the market's desire to move in a particular direction.
-
No wicks. A candle with a large body and very short or absent wicks (Marubozu) indicates a strong trend. In these conditions, it is worth considering trade entries only in the direction of that candle's close.
Several other candle types can also indicate likely price direction:
- Doji
- Star
- Gravestone
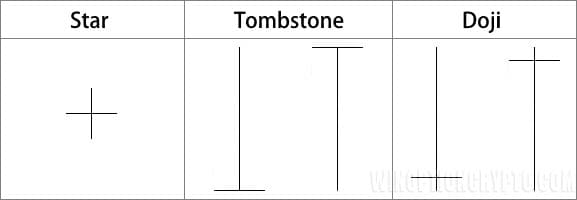
Recognising these candle types is important, as many multi-candle formations are built around them — which we turn to next.
Candlestick Patterns
There are a large number of candlestick patterns in technical analysis:
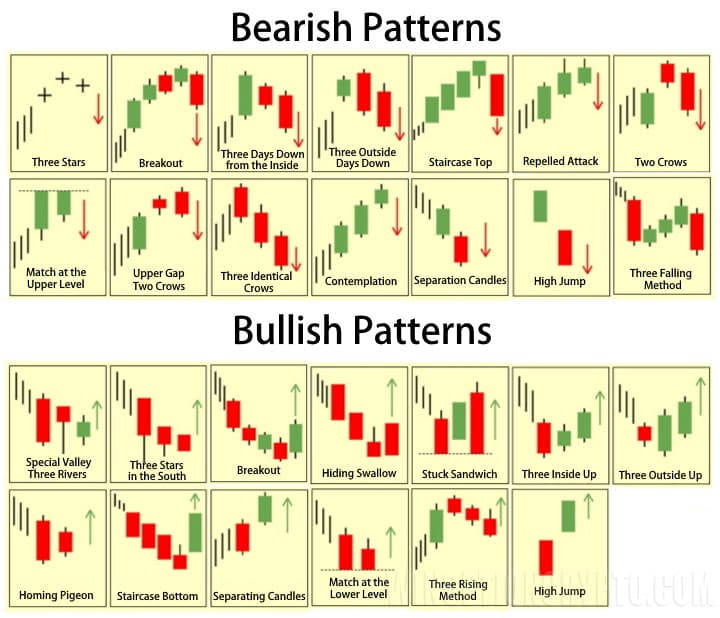
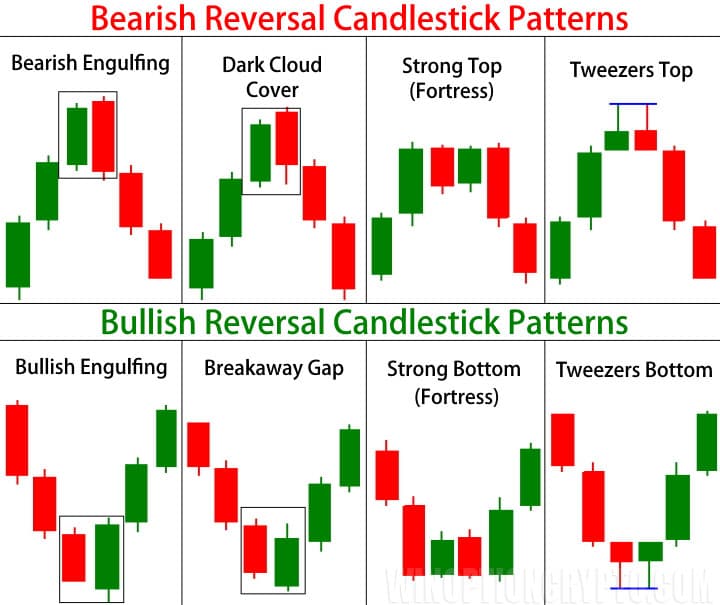
There is no need to study all of them — many appear rarely and mainly on higher timeframes. The patterns worth committing to memory are the most frequently occurring ones:
-
Engulfing (first column in the image below). The new candle's range fully covers the previous candle. In most cases, it is sufficient for the new candle's body to overlap the body of the preceding one — though a stronger signal occurs when the new candle covers both the body and wicks of the previous one.
-
Piercing Line and Dark Cloud Cover (second column in the image below). These patterns are visually similar to engulfing. The key distinction is that price first extends the prior candle's range (setting a new low for a bearish move, or a new high for a bullish move), then closes back in the opposite direction without fully covering the prior candle's range.
-
Significant top/bottom (third column in the image below). This formation appears most often at support and resistance levels, where price fails to set a new high or low and then reverses direction.
-
Tweezer tops and bottoms (fourth column in the image below). This pattern is less common but notably reliable. It consists of two candles with matching highs or lows — such as two pin bars, two Doji candles, or two crosses — where price fails to push beyond the shared extreme.
Conclusion
An important caveat: any candle type or pattern identified through candlestick analysis should only be traded in the direction of the prevailing trend. Counter-trend signals are either significantly weaker or carry no reliable predictive value at all.
When using reversal patterns, confirmation is essential — wait for price to begin moving in the direction signalled by the pattern before entering a trade.
As with any method: study it thoroughly, test it on a demo account, and only then apply it to live trading.

To leave a comment, you must register or log in to your account.