In this article we introduce one of the simplest yet most effective candlestick patterns in trading — the pin bar. Its accessibility has made it extremely popular among traders of all levels.
The pattern generates powerful entry signals that are easy to spot on a chart. Applying it requires no deep market analysis, and the bar for entry-level knowledge is very low.
It works on virtually any trading platform — all that is needed is the ability to display price charts using Japanese candlesticks or bars. Below we explain how to use this pattern when trading binary options.

Key Features of the Pin Bar Strategy
- Platform: no restrictions.
- Currency pairs: no restrictions.
- Optimal timeframe: M15 and above.
- Expiration: 3 candles.
- Trading hours: no restrictions.
- Recommended brokers: Quotex, Pocket Option, Binarium.
What Is a Pin Bar?
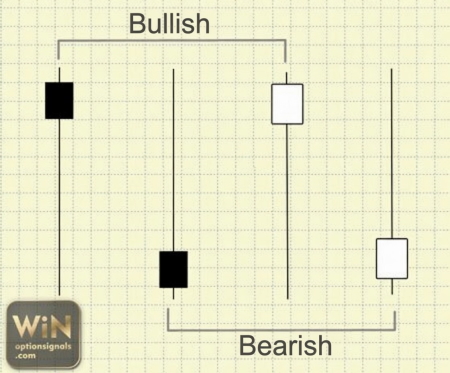 A pin bar is a candle with a very small body — or no body at all — relative to its overall size. One shadow is long, while the other is short or absent entirely.
In most cases, a pin bar acts as a reversal pattern, though it can also signal a trend continuation. The interpretation depends on the position of the candle body.
In a bullish pin bar, the closing price is close to the opening level. This tells us that the price initially declined but then recovered, erasing the move down. Strong buying pressure overcame the sellers, and we can expect that buying to continue.
A bearish pin bar works on the same logic in reverse. The price initially rises but returns to the opening level — sellers win out, and further downward movement is likely.
Trading Strategy for Binary Options
One of the simplest approaches based on this pattern is to open an option in the direction of the shorter shadow — sometimes described as trading in the direction of the "hammer." The colour of the candle is irrelevant; what matters is the position of the body. A valid signal can appear on either a bullish or bearish pin bar.
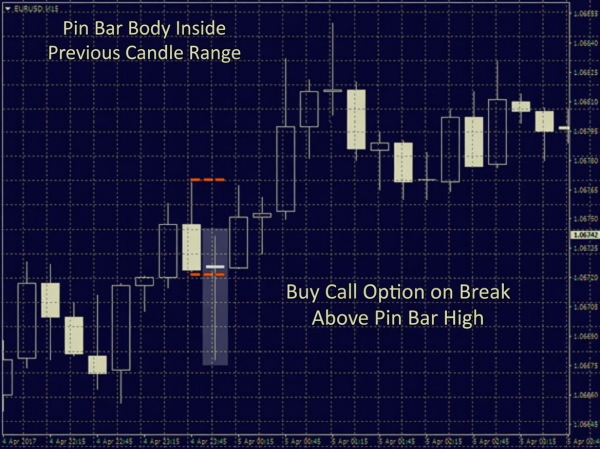
Open a Call option when all of the following conditions are met:
- A bullish pin bar has formed on the chart;
- its body does not extend beyond the range of the previous candle;
- the price breaks above the pin bar's high.
Open the Call option with an expiration of 3 candles on the timeframe in use.
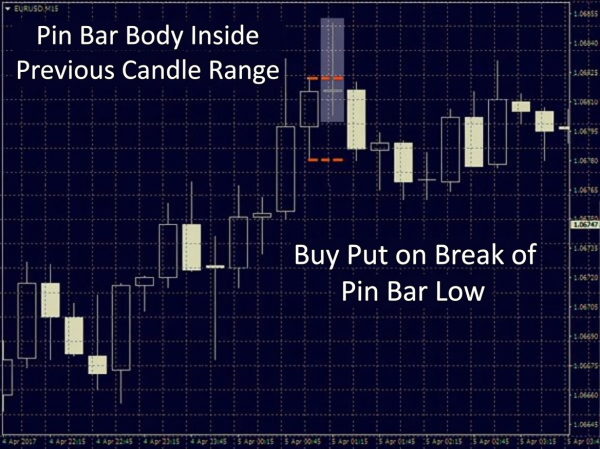
Open a Put option when all of the following conditions are met:
- A bearish pin bar has formed on the chart;
- its body does not extend beyond the range of the previous candle;
- the price breaks below the pin bar's low.
Open the Put option with an expiration of 3 candles on the timeframe in use.
It is always preferable to open positions in line with the main trend — doing so filters out a significant number of losing trades. If no clear trend is visible, it is better to wait. Signals that go against the trend, or appear during a sideways market, are the least reliable.
An expiration of 3 candles is generally optimal. On larger timeframes this can be reduced — above H1, a single-candle expiration is often sufficient. On smaller timeframes, however, do not reduce the expiration below 3 candles.
Pay attention to the size of the pin bar relative to surrounding candles. It should be close to the average candle size on the chart. If the pin bar's high-to-low range is smaller than that of the preceding candle, it is better to skip the entry.
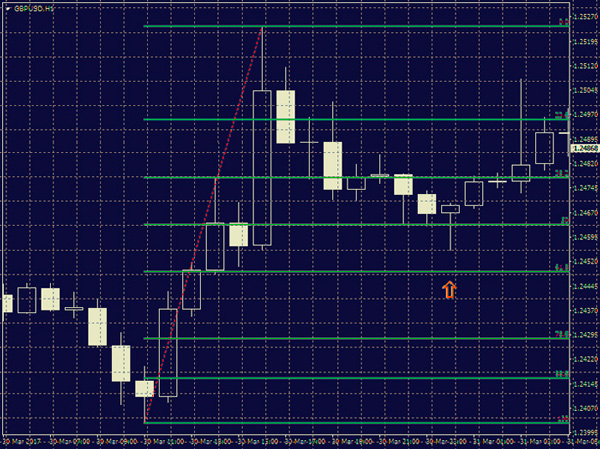
When multiple factors align to support a signal, that signal is considerably stronger. Price tends to move in the direction of least resistance, so a pin bar that forms at a key support or resistance level will produce a much more reliable signal — it is easier for the market to bounce from such a level than to break through it.
A pin bar forming at a significant Fibonacci retracement level can also produce a strong signal. Focus on the key levels: 38.2%, 50%, and 61.8%. When such a pin bar also coincides with a support or resistance level, the reliability of the signal increases further.
Signal Examples
As you can see, this strategy is genuinely straightforward. Its simplicity gives you the flexibility to fit trading around your schedule. All you need is a price chart displaying candlesticks or bars.
Do not enter a trade the moment a pin bar appears. First confirm that it meets all the criteria described above, then wait for the price to break beyond the pin bar's extreme on the side of the shorter shadow.
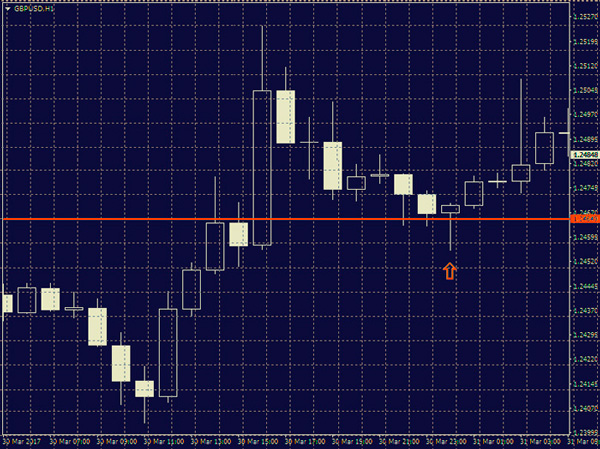
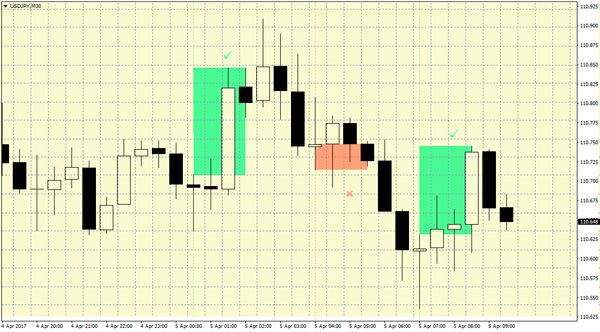
False signals cannot be avoided entirely. The example below shows a losing trade — the signal pointed against the main trend, which, as noted above, significantly reduces reliability.
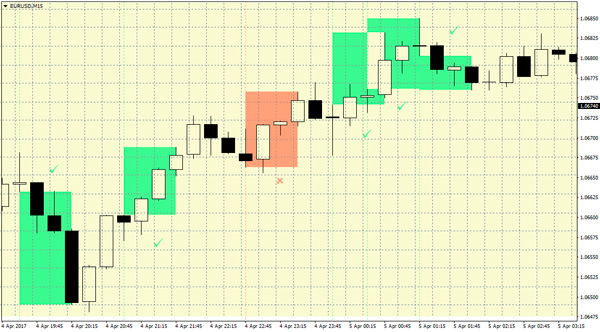
The strategy performs best on larger timeframes. That said, many traders apply it on smaller timeframes to increase trade frequency. This is a valid approach, but on lower timeframes you should be more selective and only act on the strongest signals.
Conclusion
The simplicity of the pin bar pattern is one of its greatest strengths. To trade it effectively, you simply need to learn to identify pin bars correctly on the chart and stay aligned with the main trend.
Filter out signals that appear during sideways price action or point against the trend. To improve overall performance and reduce losing trades, focus on only the most reliable setups and avoid entries where you have any doubt.
Not sure how this strategy works in practice? Leave a comment below, and subscribe to our YouTube channel WinOptionCrypto — we'll answer your questions in upcoming videos.

To leave a comment, you must register or log in to your account.