The SMA Crossover binary options indicator uses one of the most popular technical analysis methods — moving average crossover. This method can be very useful for binary options traders, but it requires careful use alongside other tools. This approach helps to clearly visualize the birth of a new trend and identify the optimal moment to enter a trade in time. The correct use of supplementary filters allows traders to weed out false market movements and trade only during hours when a clear and steady tendency is present on the chart. In this review, you'll learn which technical indicator is best suited for this role and how to build a profitable trading strategy around it.
Contents:
- Key Features
- Installation
- Overview and Settings
- Trading Rules
- Opening a Call Option
- Opening a Put Option
- Conclusion
- Download SMA Crossover
Key Features of the SMA Crossover Indicator
- Terminal: MetaTrader 4
- Timeframe: M5
- Expiration: 3 candles
- Option Types: Call/Put
- Indicators: Sma-Crossover.ex4, SuperTrend cci (mtf).ex4
- Trading instruments: currency pairs, commodities, cryptocurrencies, stocks
- Trading hours: 08:00–21:00 UTC
- Recommended brokers: Quotex, Pocket Option, Binarium
Installing the SMA Crossover Binary Options Indicator
The SMA Crossover indicator is installed on the MetaTrader 4 platform using the standard method. Add the indicator to the terminal's root folder: open the "File" menu in MetaTrader 4 and select "Open Data Folder." In the window that opens, navigate to the "MQL4" → "Indicators" folder and move all files there. Templates are installed in the same way, but must be placed in the "templates" folder instead. For a full walkthrough, watch our video:
SMA Crossover Indicator: Overview and Settings
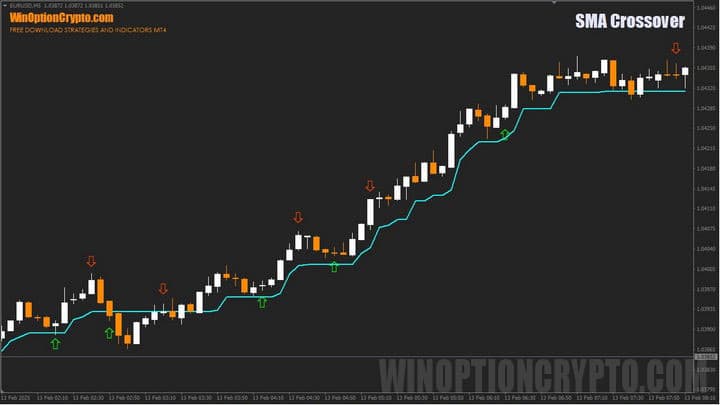
The SMA Crossover indicator will certainly appeal to traders who use moving averages in their technical analysis. Its popularity has remained strong for many years, and for good reason. This straightforward approach to price forecasting — based on calculating average values over a defined period — originated in the Forex market and has proven its effectiveness time and again. Binary options traders, like their Forex counterparts, have come to value its ability to identify trend reversals.
The SMA Crossover indicator is based on two simple moving averages with different calculation periods. The appropriate periods should be selected based on the financial instrument and timeframe you plan to trade.
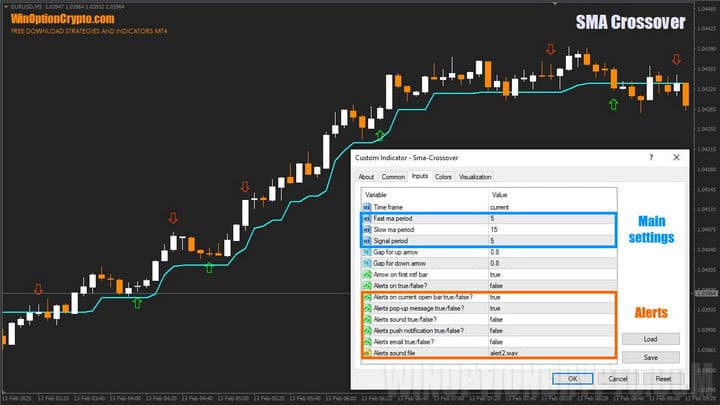
For the EUR/USD currency pair, we found the optimal calculation period for the fast moving average to be 5 and for the slow moving average to be 15. The image above shows these indicator settings along with its signals, marked with arrows.
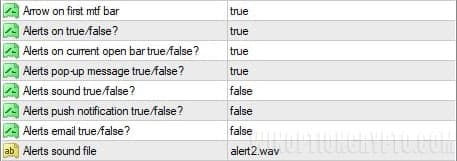
The parameters below determine how far the signal arrow appears from the candle.

You can also enable pop-up alerts, configure notifications to be sent by email, and customise the sound alert for these notifications.
Now for the most important part: a signal to buy a call option is generated when the fast moving average crosses the slow moving average from below. This behaviour indicates a strengthening bullish trend, making it a good opportunity to buy a call option.
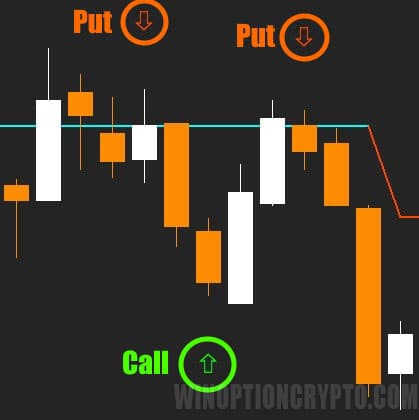
Conversely, when the fast moving average crosses from above, this signals selling pressure and the beginning of a market correction — an ideal moment to buy a put option.
Trading Rules for the SMA Crossover Indicator
The SMA Crossover indicator is an excellent tool for generating a large number of high-quality trading signals without repainting. That said, there is no holy grail in trading, and even a solid tool benefits from fine-tuning. In our experience, the Super Trend indicator is the best filter to use alongside SMA Crossover signals. It responds to changing price trends faster than classic moving averages, giving traders an earlier warning when SMA Crossover signals may no longer be reliable.
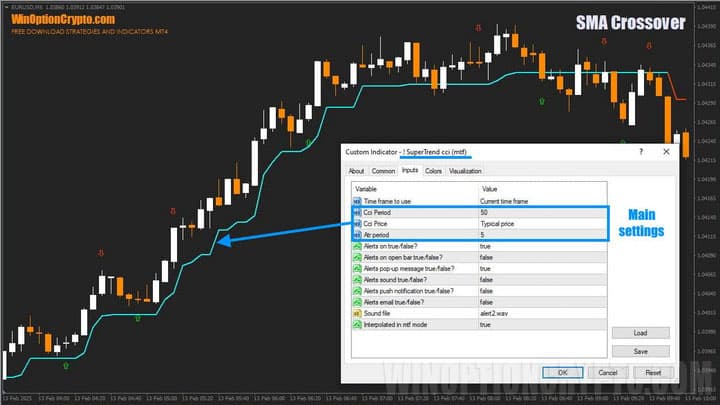
The Super Trend indicator has a small number of settings. The most important is "CCI Period." We used the default value, but it can be adjusted depending on the asset and timeframe.
With the Super Trend indicator on your chart, you can confirm the trend direction at a glance: buy call options only when the line turns blue, and buy put options only when it turns red.
If you are new to technical analysis and want to learn effective techniques, we recommend this collection of articles on our website:
- Technical analysis of binary options
- Technical analysis of cryptocurrencies
- Autochartist: Technical Analysis on the Go
- J. Murphy's book "Intermarket Technical Analysis"
Opening a Call Option
- Confirm a bullish trend — the Super Trend line is blue.
- A green SMA Crossover arrow appears.
- At the opening of the next candle, buy a call option.
Opening a Put Option
- Confirm a bearish trend — the Super Trend line is red.
- A red SMA Crossover arrow appears.
- At the opening of the next candle, buy a put option.
We recommend setting the expiration time to 3 candles, and selecting the holding period based on backtesting results.
How to Use the SMA Crossover Indicator Effectively
Through testing, we found that this indicator generates its best signals not at the moment of a trend reversal, but during the development of the trend itself. The image below shows one such example. Notice that the green arrow for buying a call option appears some time after the Super Trend line changes from red to blue.
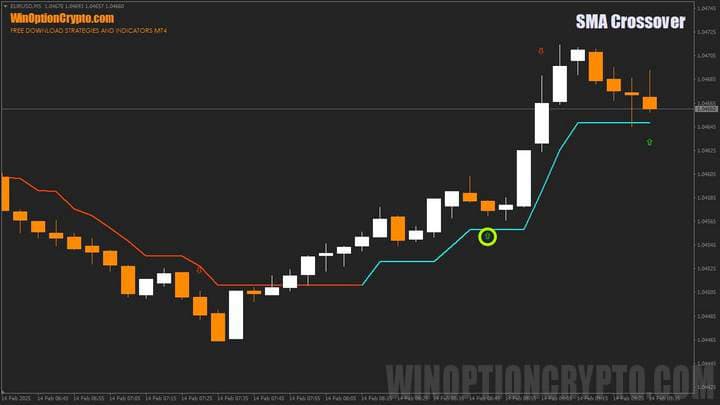
By contrast, signals generated immediately after a trend reversal are less reliable and should be treated with caution. An example of such a signal is shown below.
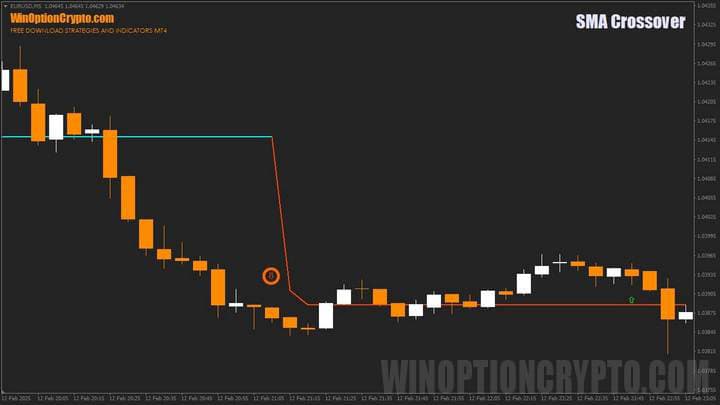
The weakness of these signals is that they appear at the end of a price move. The call option example above, by contrast, illustrates a classic trend-following entry after a correction.
Advantages of the SMA Crossover Indicator
The SMA Crossover indicator is easy to set up and use — even a novice binary options trader can integrate it into their trading with minimal effort. It is also compatible with any asset and timeframe. In addition, buy signals for call and put options are generated through mathematical calculations, which removes emotional bias from trading decisions.
Disadvantages of the SMA Crossover Indicator
Because the SMA Crossover is based on moving averages, it can struggle to keep pace with rapid market moves, which may result in false signals. This indicator should not be used in ranging markets or during off-peak trading hours. Low participation and reduced volatility during these periods increase the risk of false signals significantly. We recommend using this indicator only during active trading hours and in trending market conditions.
Conclusion
The SMA Crossover indicator can serve as an effective alternative to the classic moving averages many traders rely on. Its arrow-based signals keep the chart clean and, unlike some other indicators of this type, do not repaint.
Flexible parameter settings allow traders of all experience levels to find the right combination for their chosen asset and timeframe. Pop-up alerts and email notifications can be enabled, which is particularly convenient when trading on higher timeframes where continuous monitoring is not practical. Before trading with real funds, be sure to practise on a demo account with a reliable broker. We also recommend building good habits around risk management and capital management from the outset. We wish you successful trading and favourable trends!
Download the SMA Crossover Indicator

To leave a comment, you must register or log in to your account.