The Relative Momentum Index (RMI) indicator for binary options is far less well-known than its close relative, the Relative Strength Index (RSI). It deserves more attention, however, because it possesses a quality that most oscillators lack: it does not generate false signals during strong, sustained trends. This review covers how to apply it in binary options trading.
Contents:
- Key Features
- Installation
- Overview and Settings
- Trading Rules
- Opening a Call Option
- Opening a Put Option
- Conclusion
Key Features of the Relative Momentum Index Indicator
- Terminal: MetaTrader 4
- Timeframe: M5
- Expiration: 3 candles
- Option Types: Call/Put
- Indicators: relative-momentum-index-mtf-rmi.ex4
- Trading instruments: currency pairs, commodities, cryptocurrencies, stocks
- Trading hours: 08:00–21:00 UTC
- Recommended brokers: Quotex, Pocket Option, Binarium
Installing the Relative Momentum Index Binary Options Indicator
The Relative Momentum Index indicator is installed using the standard procedure for MetaTrader 4. Open MT4, click File, then select Open Data Folder. In the directory that opens, navigate to the MQL4 folder and then to Indicators, and move all files there. Templates are installed the same way, but placed in the Templates folder. For more detailed installation instructions, watch our video:
Relative Momentum Index Indicators: Overview and Settings
 The RMI was developed by Roger Altman, a prominent American financier who served twice as Deputy Secretary of the Treasury under Presidents Jimmy Carter and Bill Clinton. He introduced the indicator in 1993 in the journal Technical Analysis of Stocks and Commodities.
The primary goal in developing the RMI was to address the key weakness of most oscillators, including the RSI: their tendency to generate false signals during trending markets. To understand how the RMI works, it helps to first understand the RSI. The RSI compares the closing price of the current candlestick with that of the previous one, capturing gains or losses over the selected timeframe.
The RMI takes a different approach: rather than comparing adjacent bars, it compares the current closing price to the closing price N periods ago. The N parameter is user-defined and is commonly referred to by traders as "momentum".
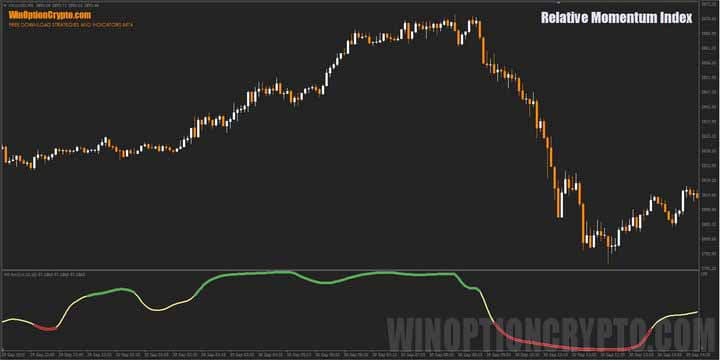
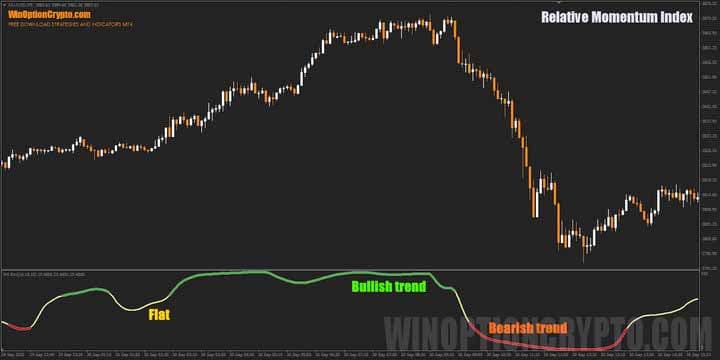
On the chart, the indicator appears at the bottom of the screen as a solid line that changes colour according to market conditions: yellow indicates a neutral phase, green a bullish market, and red a bearish one.
Altman's innovation, then, was to measure not single-bar price fluctuations but the broader momentum of market movement over a defined time interval — an approach that effectively filters out noise and keeps signals valid even during strong trends.
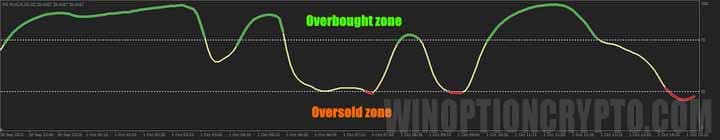
Like the RSI, the RMI identifies overbought and oversold zones. Unlike the RSI, however, entering these zones does not signal an imminent reversal — it indicates a likely continuation of the current trend.
The indicator has minimal settings, as shown in the image below.
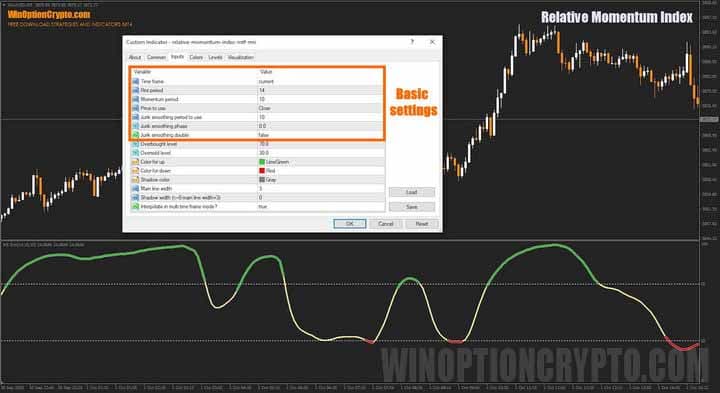
Users can select the calculation timeframe, set the RMI and momentum periods, define the price type used in calculations, and specify the Jurik smoothing period. Appearance settings and value interpolation for non-current timeframes are also available.
As you can see, configuring this technical analysis tool is straightforward. For a deeper understanding of technical analysis, the following articles are recommended:
- Technical analysis of binary options
- Technical analysis of cryptocurrencies
- Autochartist: Technical Analysis on the Go
- J. Murphy's book "Intermarket Technical Analysis"
Trading Rules for the Relative Momentum Index Indicator
Trading with the RMI is straightforward: wait for the oscillator to change colour from neutral yellow to green or red, then open a position when the candle closes in the corresponding direction.
Opening a Call Option
- Wait for the oscillator to change from yellow to green.
- Confirm that the candle closed with a gain.
- Buy a Call option at the open of the next candle.
Opening a Put Option
- Wait for the oscillator to change from yellow to red.
- Confirm that the candle closed lower.
- Buy a Put option at the open of the next candle.
The recommended expiration time is three candles. The optimal holding period varies by asset and should be determined through backtesting on historical data, which will help tailor the strategy to the instrument and improve overall performance.
Specifics of Using the Relative Momentum Index Indicator
The RMI's calculation method produces smoother, more reliable signals that are less susceptible to market noise. Traders can use this to their advantage by applying the indicator to assess long-term trend momentum with greater accuracy.
Advantages of the Relative Momentum Index
Thanks to improved noise filtering, the RMI provides more dependable trend signals than most oscillators. By measuring price changes over N periods rather than between adjacent bars, it is less reactive to minor fluctuations — which translates into fewer false signals during trending conditions.
Disadvantages of the Relative Momentum Index
The primary drawback of this moving average-based indicator is signal lag. Because of the smoothing involved, the RMI may react more slowly than the RSI during sharp market reversals, resulting in delayed entries. False signals are also possible during trend reversals and when the market transitions from strong momentum into consolidation.
Conclusion
The Relative Momentum Index indicator helps identify reliable entry points for binary options trading. For consistent results, its signals are best combined with trend indicators such as moving averages or support and resistance levels.
Before using the RMI with real funds, practise on a demo account with a reliable broker. Take the time to understand the indicator's behaviour and apply it within a disciplined framework, always observing sound risk and capital management principles. Good luck with your trading!
Download the Relative Momentum Index Indicator

See Also:
- How to make money on binary options
- How do binary options brokers make money?
- Top 5 Binary Options Trader Mistakes
- Binary options broker bonuses
To leave a comment, you must register or log in to your account.