The Candle Meter binary options indicator reveals information that has long been considered beyond the reach of the average trader — namely, the ongoing struggle between supply and demand. Many traders have heard of this concept, but few have been able to visualise it directly. The Candle Meter indicator does exactly that, making the buyer-seller dynamic visible and accessible for analysis.
With this knowledge, you will know precisely who controls the market at any given moment. That is why the $199 price tag for this tool does not seem unreasonable. With the insights we share in this review, you will be able to anticipate how the next candle is likely to close — and in binary options trading, that is a significant edge. Read on to find out how to put this indicator to practical use and take your trading to the next level.
Content:
- Key Features
- Installation
- Overview and Settings
- Candle Meter Trading Rules
- Opening a Call Option
- Opening a Put Option
- Conclusion
- Download Candle Meter
Key Features of the Candle Meter Indicator
- Terminal: MetaTrader 4
- Timeframe: M5
- Expiration: 3 candles
- Option Types: Call/Put
- Indicators: Candle Meter.ex4
- Trading instruments: currency pairs, commodities, cryptocurrencies, stocks
- Trading hours: 08:00–21:00 UTC.
- Recommended brokers: Quotex, Pocket Option, Binarium
Installing the Candle Meter Indicator
The Candle Meter indicator is installed using the standard procedure for MetaTrader 4. Open MT4, click File, then select Open Data Folder. In the directory that opens, navigate to the MQL4 folder and then to Indicators, and move all indicator files there. Templates are installed the same way, but placed in the Templates folder. For more detailed installation instructions, watch our video:
Overview and Settings of the Candle Meter Indicator
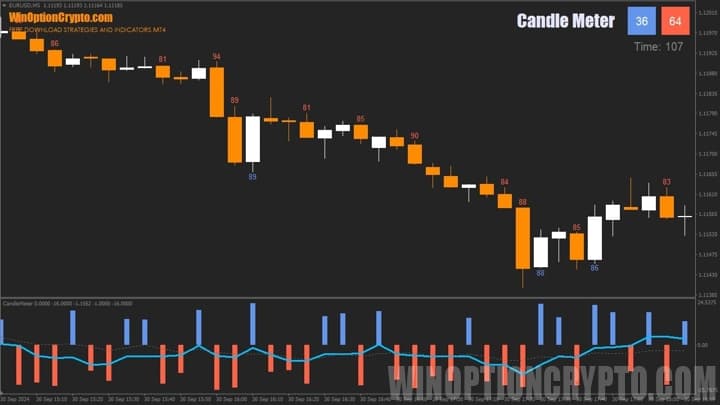
The Candle Meter indicator analyses the relative strength of buyers and sellers within each candle. The result of this analysis — showing who prevailed over the previous 5 minutes, 15 minutes, or 1 hour, depending on the active timeframe — is displayed beneath each candle, transforming the standard candlestick chart into an informative tool for reading market momentum.
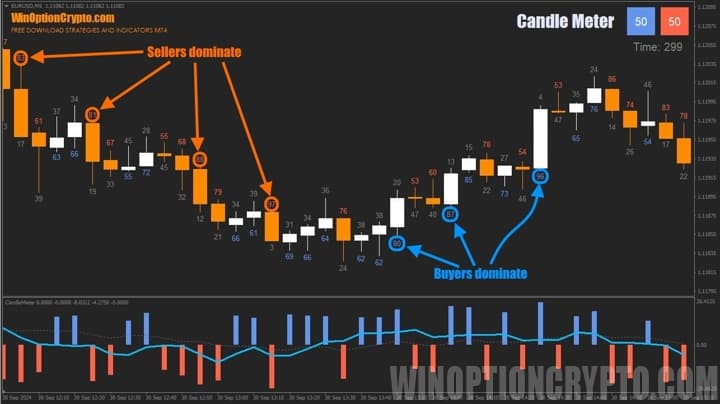
As shown in the screenshot above, knowing which side won the previous time interval gives you a reliable indication of where the market is heading. If the number above the candle exceeds 80, bears are in control and prices are likely to fall. If the number below the candle exceeds 80, bulls are dominant and prices are rising.
Also note the indicator panel in the upper right corner of the chart. It shows the current buyer-seller balance in real time, with a countdown timer just below it showing the seconds remaining until the current candle closes.
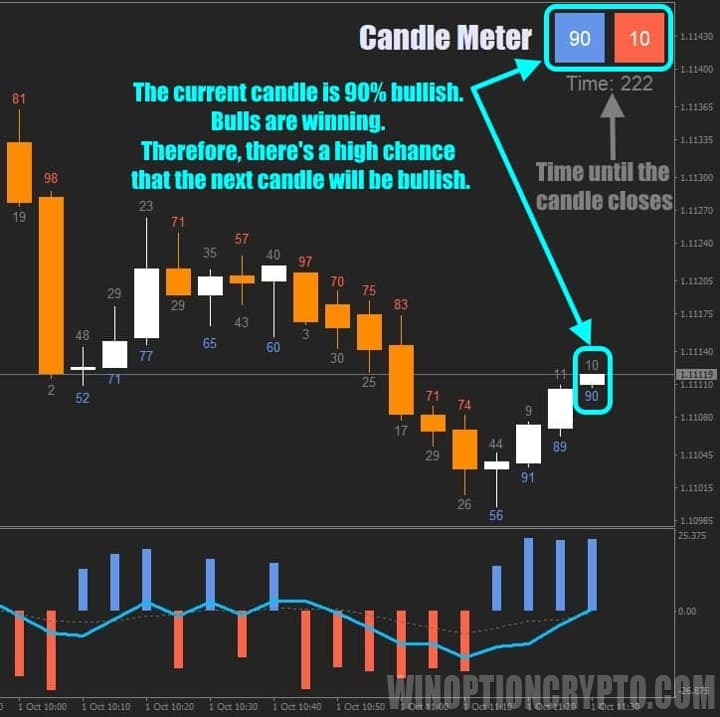
Reading the indicator values is straightforward: the higher the number, the more decisively bullish or bearish the candle, and the greater the likelihood that the next candle will close in the same direction.
For example, in the image to the left, market forces are split 90/10 in favour of buyers. This suggests a high probability of continued upward movement. That said, it is advisable to wait for the candle to close before acting, as the balance of power can shift at any point before that moment.
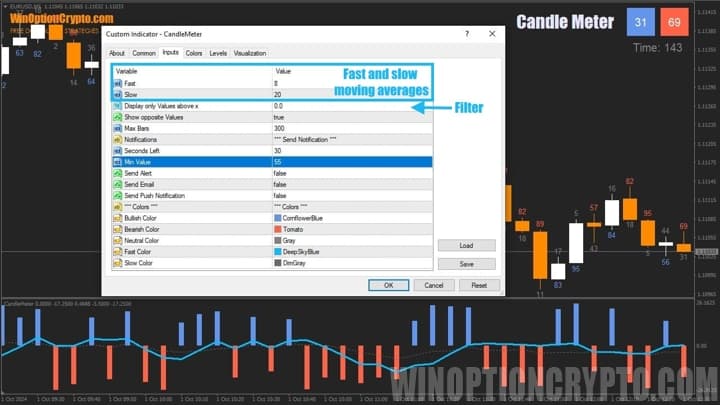
In addition to the main chart, the Candle Meter indicator displays supplementary information in the form of a histogram and two moving averages.
The histogram visualises how the balance of power between buyers and sellers has shifted over time. It allows traders to track changes in supply and demand dynamics and identify recurring patterns with stronger predictive value.
The indicator has minimal settings. Users can adjust the histogram parameters for moving average calculations, enable a bar display filter to show only values at or above a specified threshold, activate alerts, and customise the visual appearance of the indicator's elements.
Candle Meter Trading Rules
The Candle Meter indicator provides timely warnings of approaching trend changes, making trading with it both informative and potentially profitable. Here is how to apply it in practice.
First, a reminder of a well-established principle: trend-following strategies tend to produce better results over time. All trades using the Candle Meter indicator should therefore be opened in the direction of the prevailing trend. The indicator itself provides the tools needed to identify that trend.
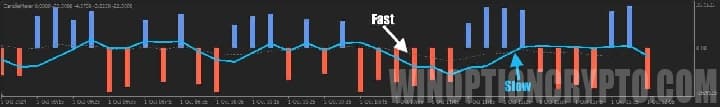
In addition to measuring candle strength, Candle Meter displays an oscillator with two moving averages at the bottom of the chart. This is the component used for trend identification.
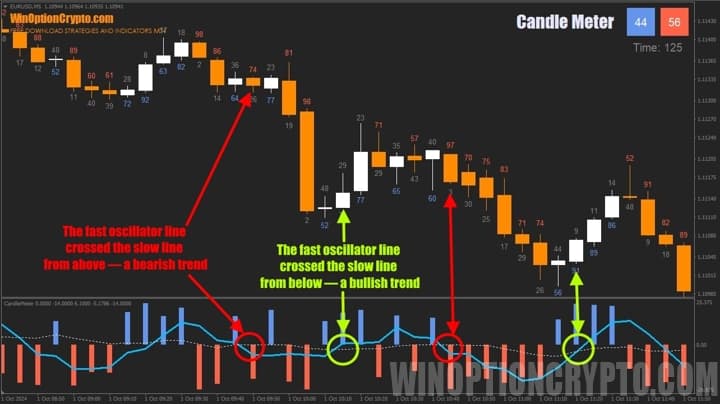
When the fast moving average crosses the slow one from top to bottom, a bearish trend is forming. When it crosses from bottom to top, buyers are taking control and a bullish move is likely beginning. For a deeper understanding of trend dynamics, we recommend the following articles on our website:
- How does a trend work in the markets?
- Identifying and using bullish and bearish trends.
- Market phase changes.
- How to identify a consolidating market.
As an additional filter for trading signals, we recommend setting the minimum display threshold for buyer and seller pressure to 80. With this setting, the Candle Meter indicator will only show values of 80 or above on the chart, helping to filter out weak crossovers of the oscillator's moving averages.
Opening a Call Option
- Confirm a bullish trend — the fast moving average of the oscillator has crossed the slow one from bottom to top.
- A value of ≥80 appears below the last closed candle.
- Buy a Call option at the open of the next candle.
Opening a Put Option
- Confirm a bearish trend — the fast moving average of the oscillator has crossed the slow one from top to bottom.
- A value of ≥80 appears above the last closed candle.
- Buy a Put option at the open of the next candle.
The recommended expiration time is 3 candles. Adjust the holding period based on backtesting results for the specific asset being traded.
Specifics of Using the Candle Meter Indicator
The Candle Meter indicator is versatile and can be applied in several ways beyond its built-in oscillator. One effective approach is using it to identify the end of a pullback within an existing trend. In this case, the primary trend direction is determined using one of the best trend indicators, while Candle Meter is used to time the entry — specifically, by watching for diminishing pressure from the counter-trend side.
As a bearish trend pullback approaches its end, buying activity weakens and the values below the candles begin to decrease. In a bullish trend pullback, the reverse applies: as the correction loses momentum, selling pressure fades and the values above the candles decline.
Pros of the Candle Meter Indicator
The key advantage of this tool is the ability to observe the buyer-seller balance in real time. By displaying the percentage of buy and sell transactions executed over a given period, the indicator gives traders an objective, quantifiable view of who is in control of a specific asset at any moment. When buyers dominate, the candle closes with a gain — reflected by a buy transaction percentage above 80%. When sellers prevail, the candle closes lower, with a sell percentage above 80%.
Cons of the Candle Meter Indicator
To reduce the number of false signals, additional trend filtering may be necessary. The optimal display threshold for the prevailing side also needs to be calibrated individually for each asset.
Conclusion
The Candle Meter binary options indicator gives traders a quantified view of buyer and seller activity over any given period — effectively pulling back the curtain on the forces driving price. This perspective allows traders to look at familiar candlestick patterns and chart formations with greater confidence. Trading in the direction of the dominant side — backed by data rather than intuition — makes for a more disciplined and consistent approach.
Given the exclusive information this indicator provides, we consider its price well justified, and believe there are many ways it can be applied. We encourage experienced traders to share their experience in the comments below. Beginners should start with a demo account at one of the best brokers, and only move to live trading once consistently positive results have been achieved — always following sound risk management and capital management principles. Good luck with your trading!
Download the Candle Meter Indicator

To leave a comment, you must register or log in to your account.