The Volume Trading binary options strategy generates entry signals based on overbought and oversold conditions identified through candle volume changes. Indicator signals do not repaint and, according to the developer, appear before the candle closes — allowing the trader to identify a potential reversal at the start of the move.
How effective is the strategy in practice? What results does it deliver in real time? And how can false signals be filtered out? This article addresses all three questions.
Key Features of the Volume Trading Strategy
- Terminal: MetaTrader 4
- Timeframes: any; M30 or higher recommended
- Expiration: 1 candle
- Option types: Call / Put
- Indicators: _Data Volume.ex4, _Linex.ex4
- Instruments: currency pairs, cryptocurrencies, stocks, commodities
- Trading hours: 24/7
- Recommended brokers: Quotex, PocketOption, Binarium
Installing the Volume Trading Binary Options Strategy
Indicators are installed in the standard way in MetaTrader 4. For a step-by-step walkthrough, see the MetaTrader 4 guide or the installation video below:
The simplest approach is to install the indicators using the template included with the download at the end of this article.
Volume Trading Indicators: Overview and Settings
The strategy is positioned by its developers as an effective tool for predicting trend changes, with overbought and oversold market conditions serving as the primary entry signals.
Overbought describes a situation in which price has risen too far, too fast:
Oversold describes the opposite — price has fallen too far, too fast:
The strategy's logic is remarkably simple:
- If price rises too quickly, a decline is expected.
- If price falls too quickly, a rise is expected.
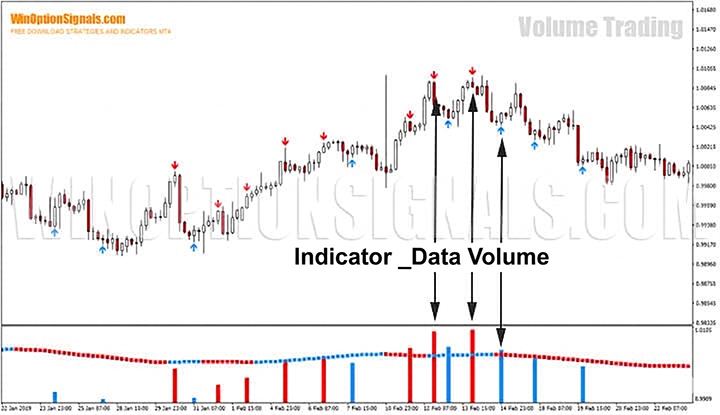
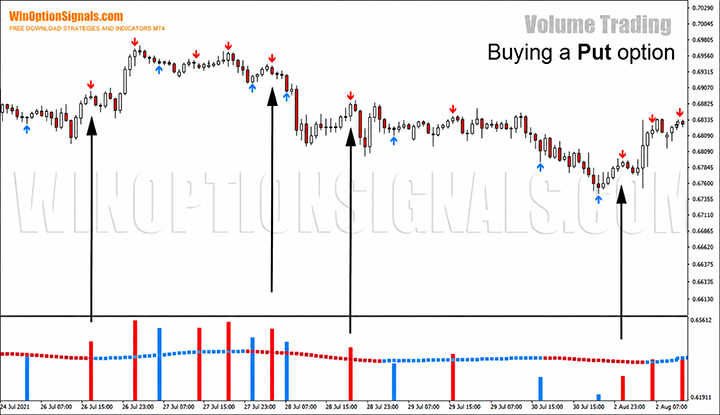
The trader is not required to perform technical or fundamental analysis, or even monitor the market — the Data Volume indicator handles this. It appears as a histogram at the bottom of the MetaTrader 4 platform, with blue (up) and red (down) arrows on the price chart. This is the strategy's primary indicator, signalling potential changes in price movement.
Note: indicator signals do not repaint. Moreover, up and down signals appear before the candle closes. For a broader selection, see our roundup of the best non-repainting indicators for binary options.
We do not recommend changing the indicator's default parameters. Note that alerts are enabled by default in the terminal, by email, and by mobile phone. To disable mobile notifications, change the value of the "Alertformobile" variable to "false":
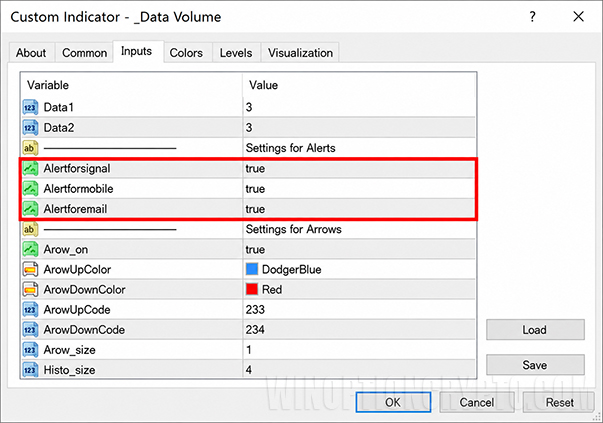
The indicator's built-in alerts serve as early warnings: "Oversold/Overbought Attention" messages may appear in the terminal, providing the trader with an initial signal that a possible overbought or oversold condition has been detected.
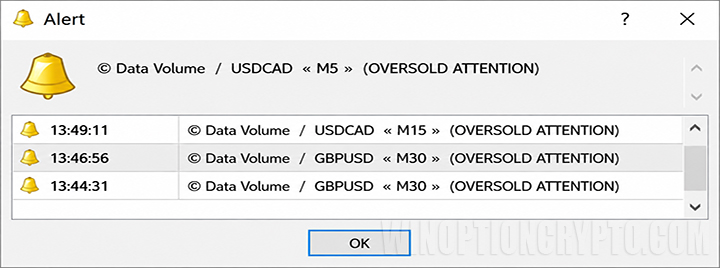
This is only a preliminary signal — before buying options, wait for confirmation from the second indicator.
The Linex indicator is the strategy's second indicator and serves to confirm the signal. It is also located at the bottom of the MetaTrader 4 platform and appears as a horizontal line crossing the Data Volume volume histogram. The indicator's colour determines the trade direction: blue confirms a Call option ("Higher"); red confirms a Put option ("Lower").
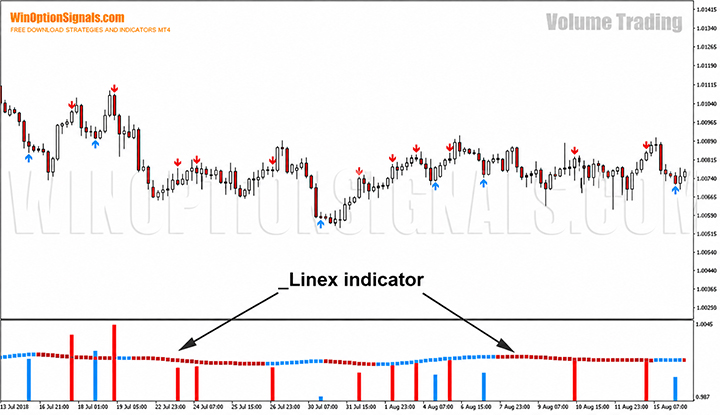
It is worth noting that this indicator is based on tick volume rather than real exchange volume. Despite this, tick volumes can still be used profitably in binary options trading.
Volume Trading Strategy Rules
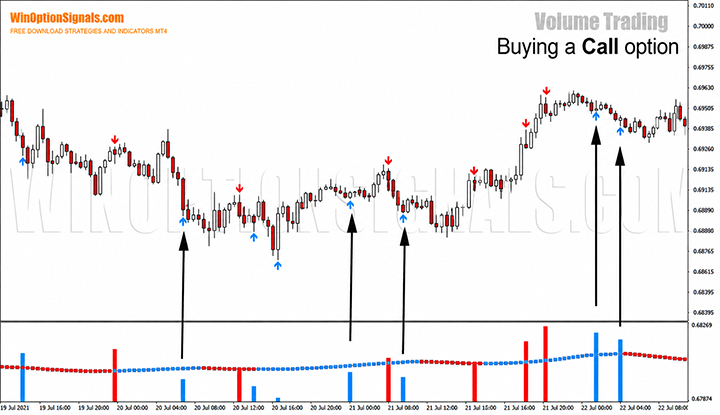
Buy a Call option ("Higher") when:
- An up arrow (blue) appears on the chart;
- the Data Volume histogram column is blue;
- the Linex line colour matches the Data Volume indicator colour.
Buy a Put option ("Lower") when:
- A down arrow (red) has formed on the chart;
- the Data Volume histogram column is red;
- the Linex indicator colour matches the Data Volume indicator colour.
Recommended expiration time: 1 candle.
- M1 charts — 1 minute
- M5 charts — 5 minutes
- M15 charts — 15 minutes
- M30 charts — 30 minutes
- H1 charts — 1 hour
The combination of built-in alerts and a short expiration makes option buying more convenient: an alert from the primary indicator, a confirming signal from the second, and a trade is opened with an expiration as short as one minute. At first glance, this is very convenient for the trader, both technically and psychologically. But how effective is this system in practice, and what profit or loss can it deliver on a live account?
Volume Trading Signals
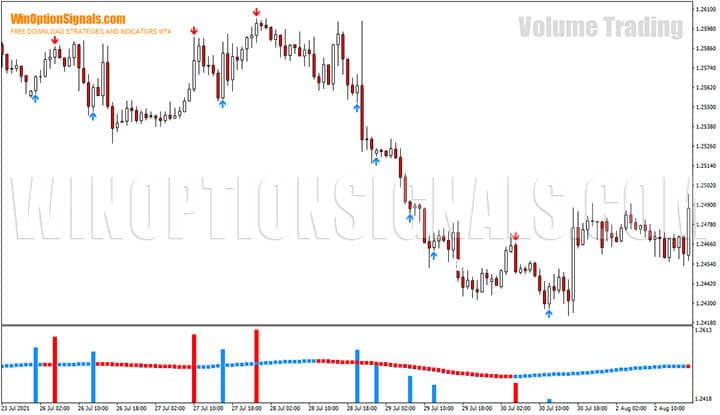
Let's examine how the system performs on NZD/USD, H1 timeframe:
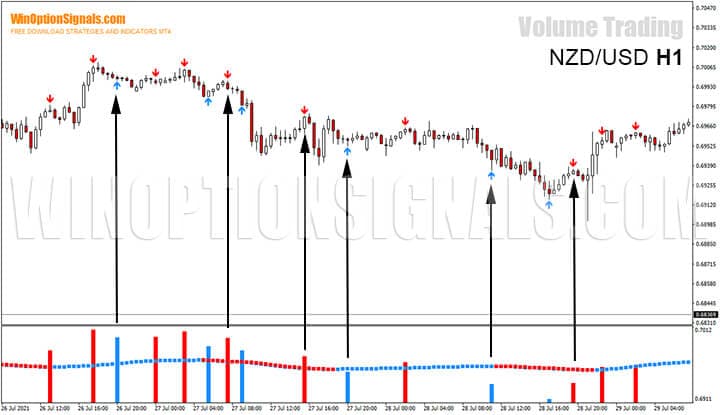
The chart above shows a steady bearish trend that transitions to a bullish trend toward the right edge. According to the strategy's rules, six entry points are clearly visible: three for Put options and three for Call options. At first glance, a significant proportion appear to be false signals, with a ratio of profitable to unprofitable trades of around 50% — which is very low even for the forex market.
As we've seen, Volume Trading, like all other publicly available strategies, does not work without additional market analysis. And since this strategy is a reversal strategy, support and resistance levels and Japanese candlesticks can be of significant help.
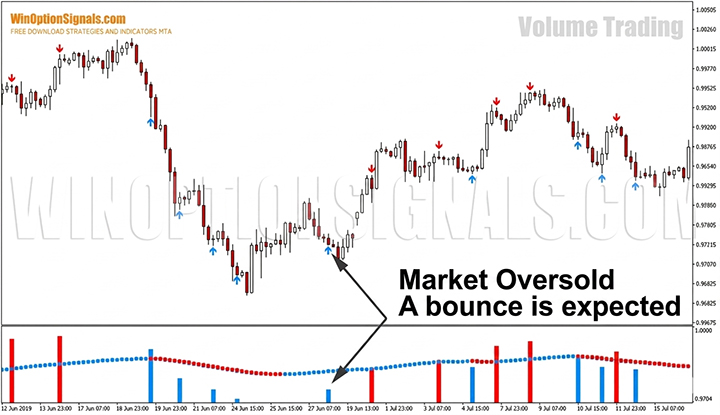
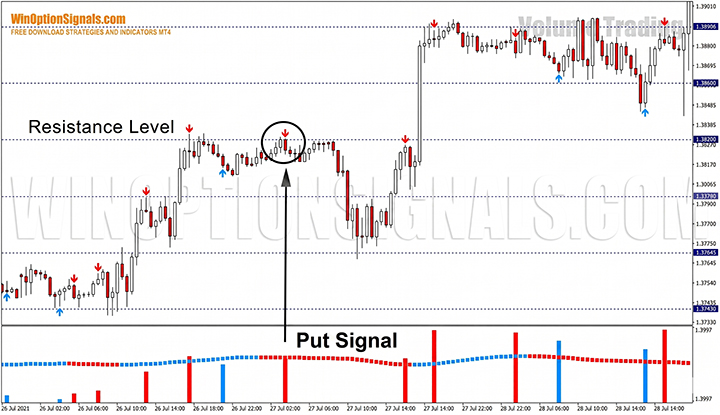
The chart below (GBP/USD, M30 timeframe) is a clear example of combining several tools to identify an entry point: the Data Volume indicator signals a price reversal, the Linex indicator confirms the signal, and the candle closes below a resistance level. This signal not only produced an excellent trade but also gave advance warning of a short-term change in price movement.
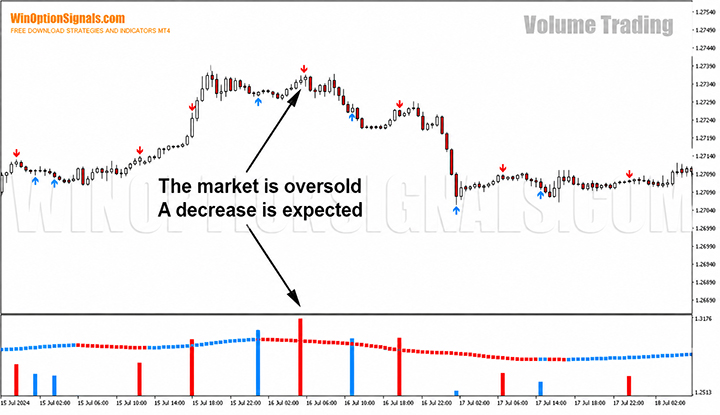
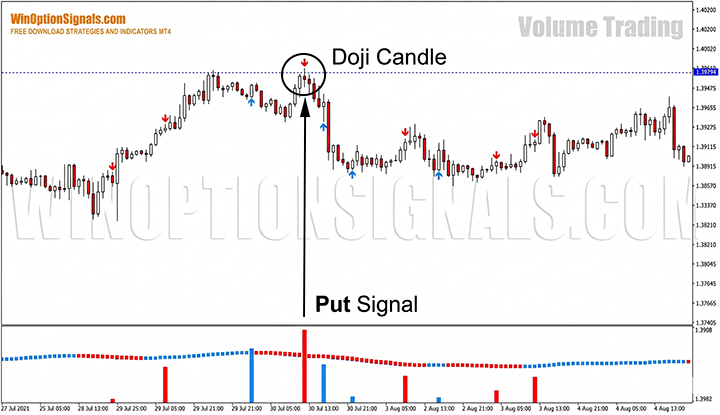
Another example (GBP/USD, H1 timeframe) shows a confluence of Volume Trading signals and candlestick analysis: a Put signal is generated, and the candle closes as a Doji reversal pattern below a resistance level. The chart below shows an extremely precise market entry with minimal risk.
Conclusion
After reviewing this strategy, we can conclude that it is better suited to market analysis than to identifying entry points. Too many signals from the Data Volume indicator and a frankly poor filter from the additional Linex indicator make this strategy unprofitable in the short term, let alone the long term. However, the results can be improved by combining it with the fundamentals of chart pattern analysis, candlestick analysis, and key levels, as demonstrated in the examples above.
Even so, before trading on a live account, test this strategy on a free demo account. Pay close attention to money management and risk management to protect your deposit from being wiped out.
If you still want to try trading this strategy specifically with binary options, you'll need to find a broker that supports expiration times of at least one day. Brokers offering this include Deriv and Binarium.
Download Volume Trading
Not sure how a particular strategy or indicator works? Leave a comment below, and subscribe to our YouTube channel WinOptionCrypto — we'll answer your questions in upcoming videos.

To leave a comment, you must register or log in to your account.