The MA RIBBON binary options indicator is a classic technical analysis tool. Despite its straightforward components, its visual clarity and ability to accurately identify trends make it well suited to trend-following traders. In this dedicated review, we cover how to configure it optimally and introduce a supplementary tool that can significantly increase the percentage of winning binary options trades.
Content:
- Key Features
- Installation
- MA RIBBON: Overview and Settings
- Trading Rules
- Opening a Call Option
- Opening a Put Option
- Conclusion
- Download MA RIBBON
Key Features of the MA RIBBON Indicator
- Terminal: MetaTrader 4
- Timeframe: M5
- Expiration: 3 candles
- Option types: Call/Put
- Indicators: MA RIBBON.ex4
- Trading instruments: currency pairs, commodities, cryptocurrencies, stocks
- Trading hours: 08:00–21:00 UTC
- Recommended brokers: Quotex, Pocket Option, Binarium
Installing the MA RIBBON Binary Options Indicator
The MA RIBBON indicator is installed in MetaTrader 4 using the standard procedure. Open MT4, select "File", then "Open Data Folder." In the folder that opens, navigate to "MQL4", then "Indicators", and move all the indicator files there. Templates are installed the same way, but go into the "templates" folder. Detailed installation instructions are available in our video:
MA RIBBON Indicators: Overview and Settings
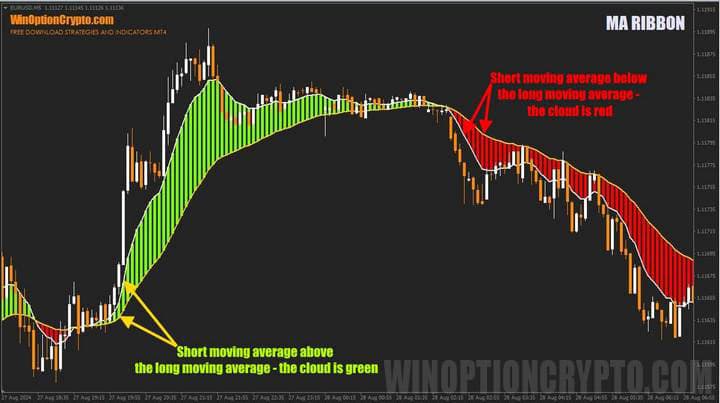
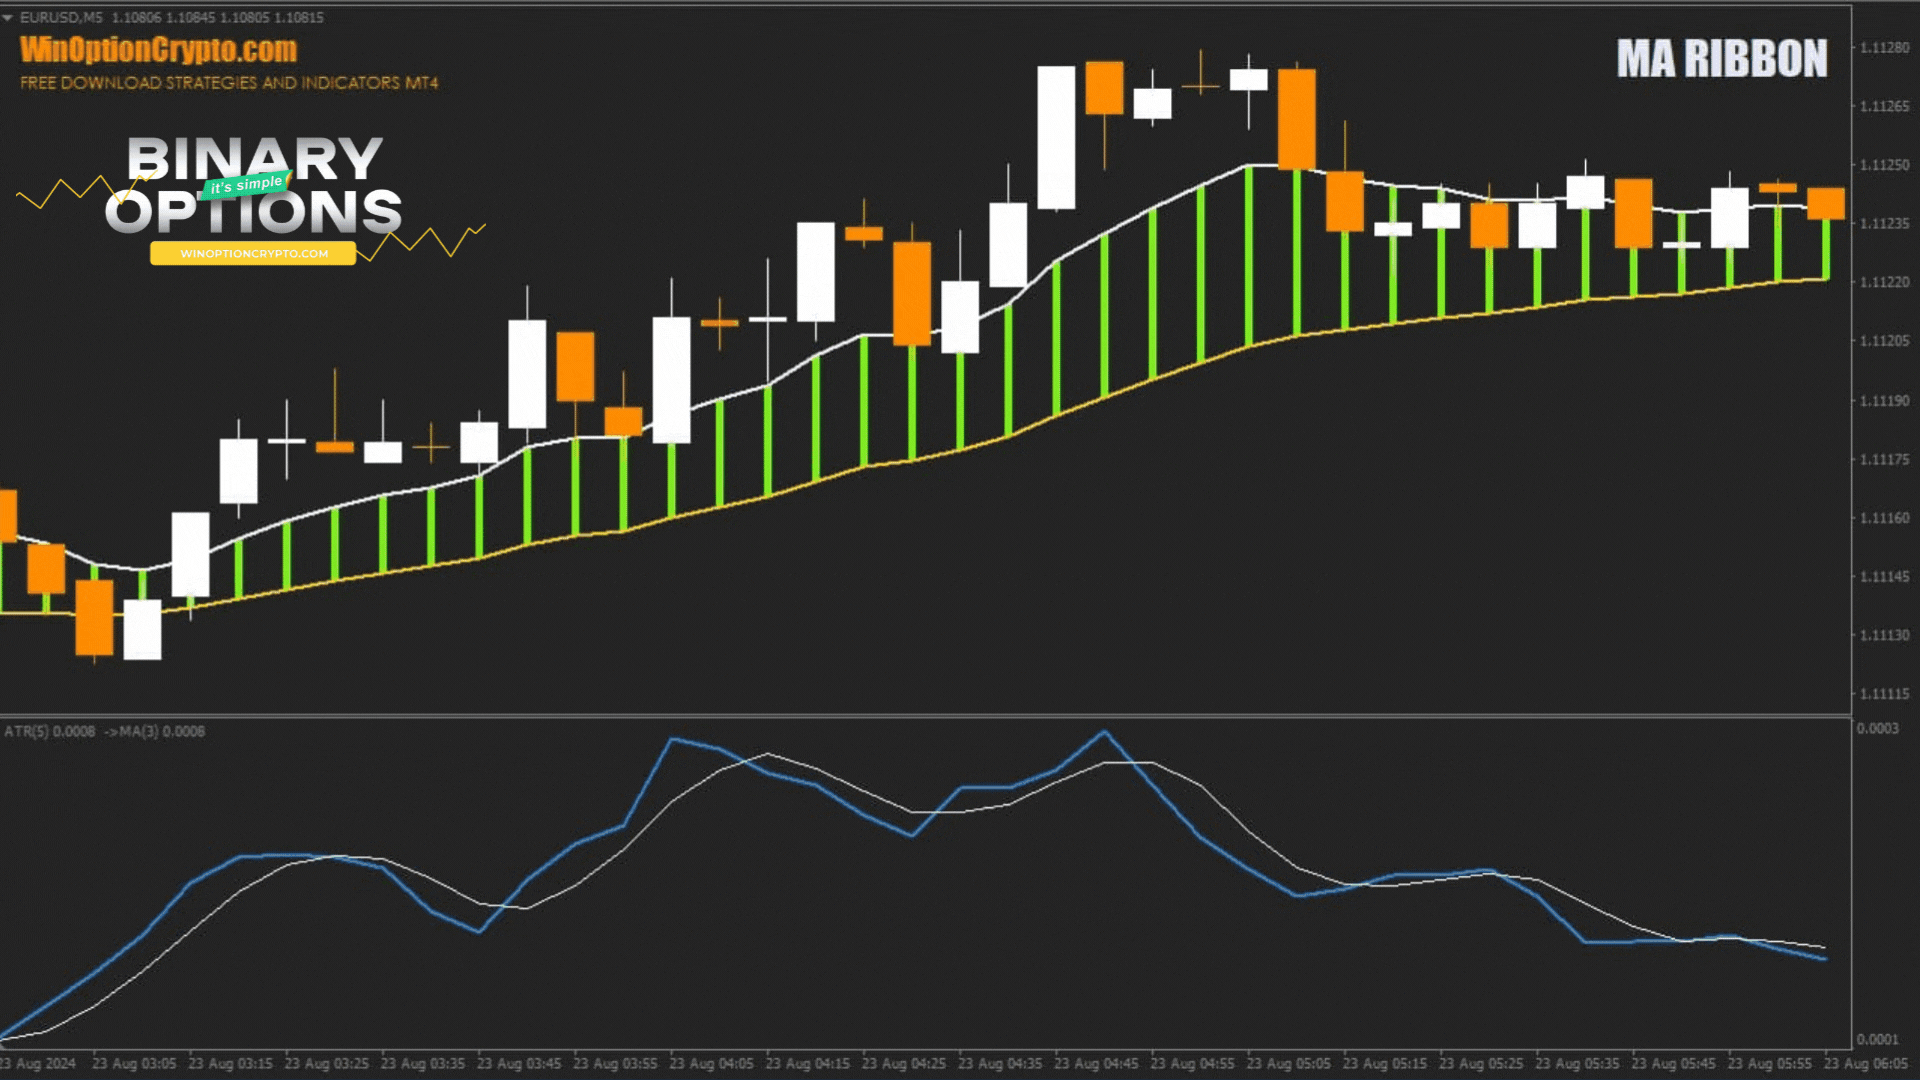
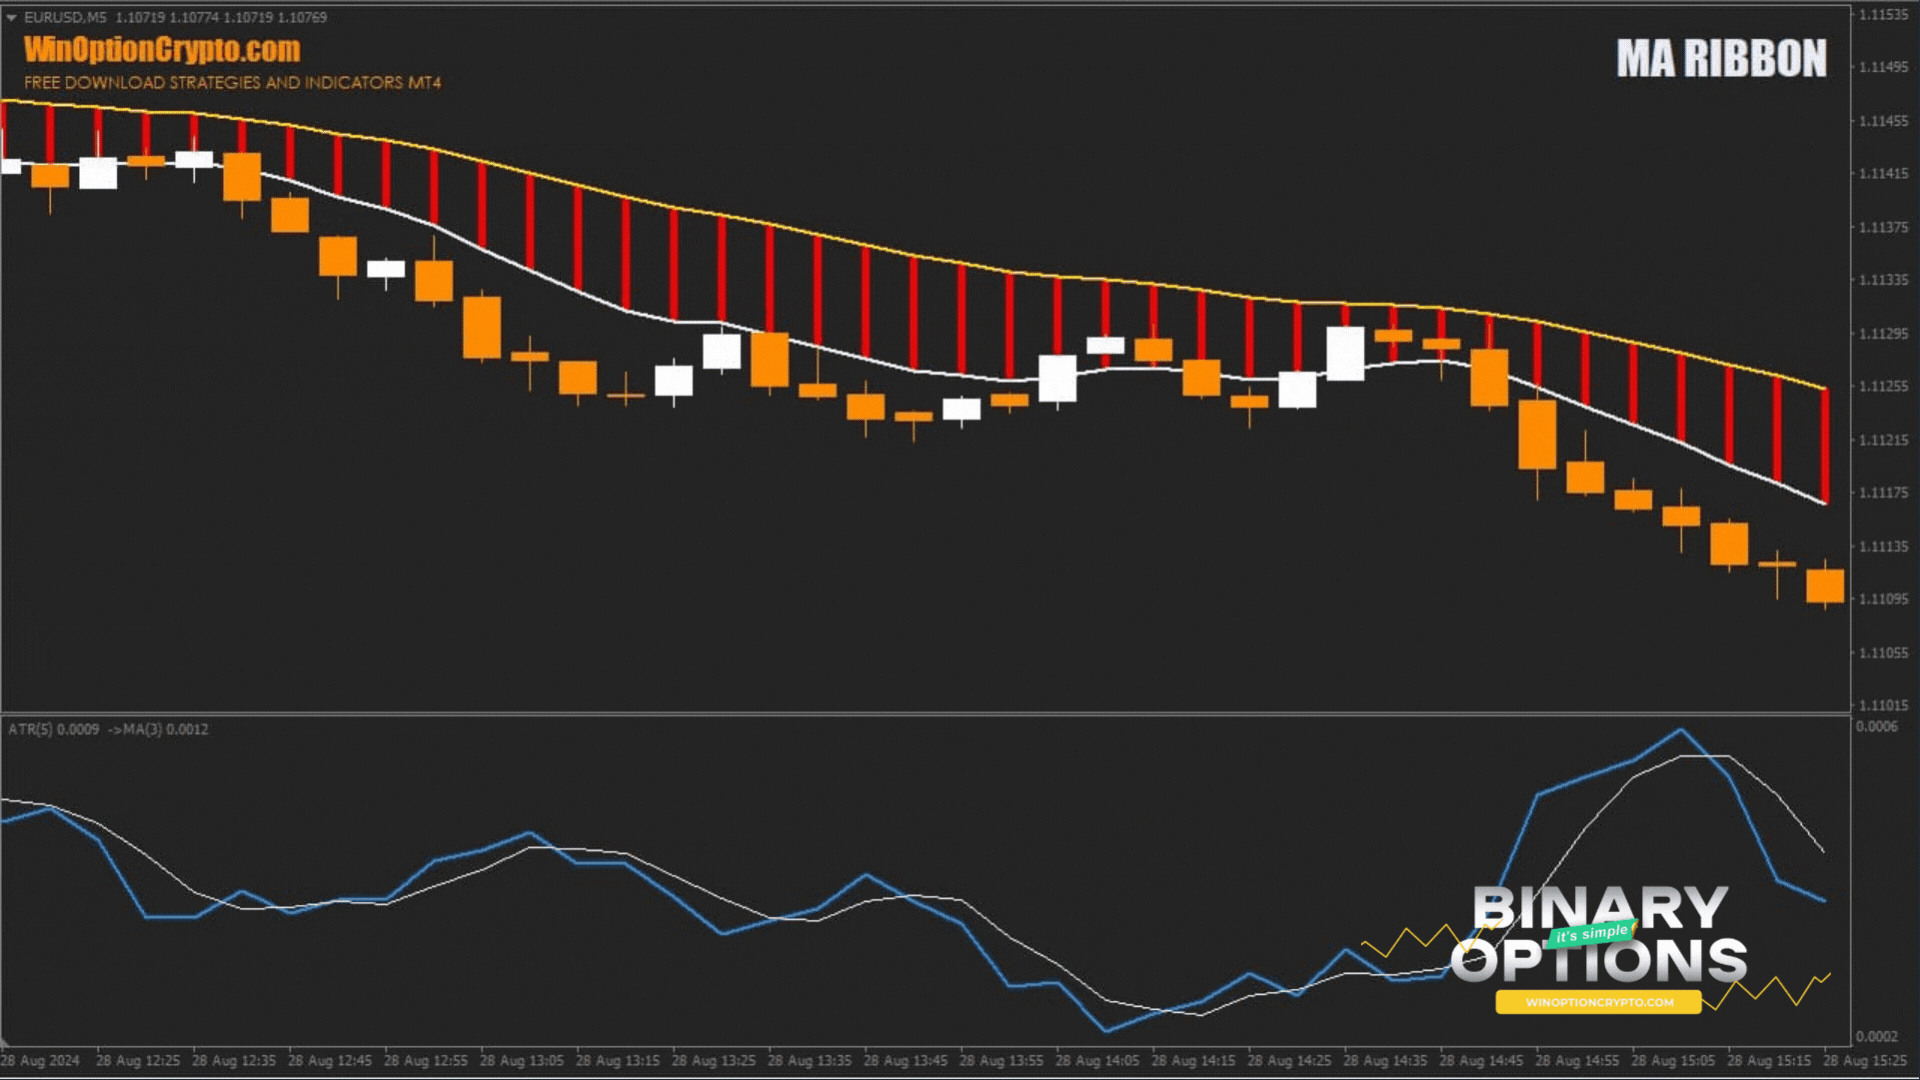
The MA RIBBON indicator combines two moving averages displayed as a coloured "cloud." When the shorter moving average is above the longer one, the cloud turns green; when the opposite is true, it turns red.
The MA RIBBON indicator can be applied to stocks, forex pairs, and cryptocurrencies. It is recommended to use it on timeframes of M5 and higher, as it generates a significant number of false signals on shorter timeframes.
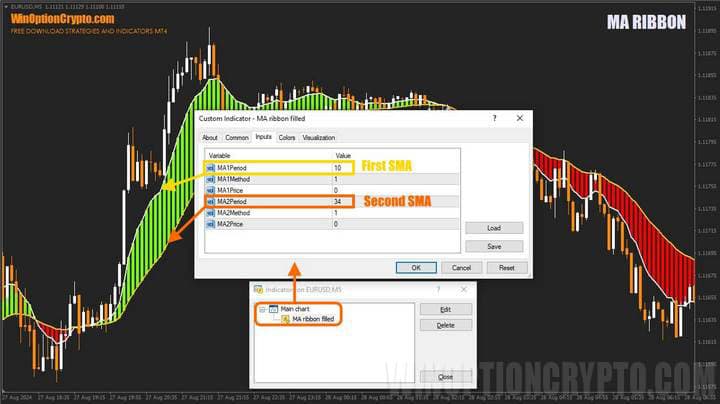
The indicator has few settings; the main ones are highlighted in the screenshot above. The MA1Period parameter controls the calculation period for the fast moving average, and MA2Period controls the period for the slow moving average. You can also configure the calculation method for the averages and the price type used in the calculation.
MA RIBBON Trading Rules
The MA RIBBON indicator generates trend initiation trading signals based on the crossover of its two moving averages. For profitable binary options trading, however, the appearance of a green or red cloud is not sufficient on its own. Opening Call and Put options therefore requires waiting for specific conditions to be met, sometimes confirmed by candlestick patterns, which we cover in detail in the following articles:
- Candlestick analysis and binary options.
- Japanese Candlesticks for Beginners and How to Read Them.
- Japanese candlesticks — graphical analysis.
- Using pin bars in binary options trading.
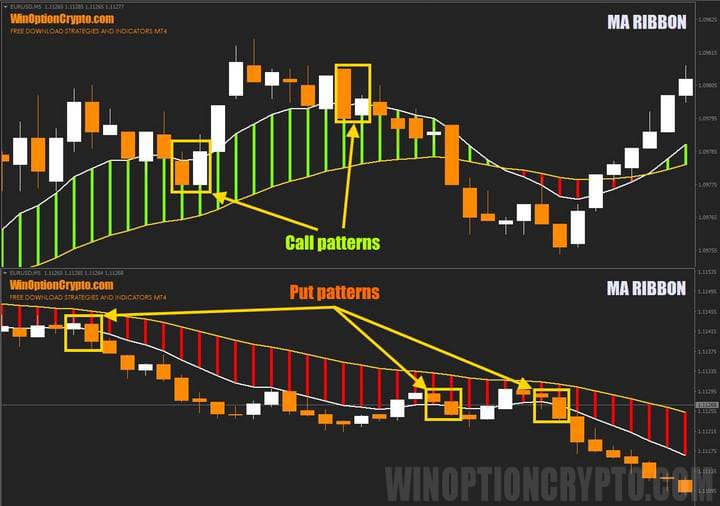
Call options are opened when the short-term moving average is above the long-term moving average, confirmed by the formation of a green cloud. Put options are opened in the opposite situation — when the short-term moving average is below the long-term one, forming a red cloud. This determines the trading direction. The entry point is defined by a candlestick pattern: the previous candle closes within the cloud, and the current (most recent) candle closes outside it, in the trade direction.
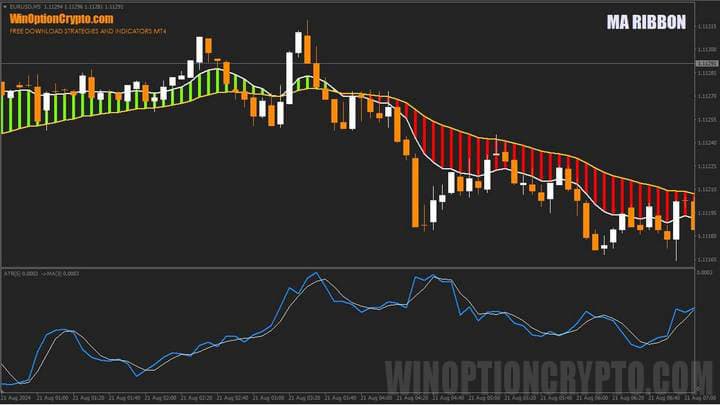
To increase the percentage of winning trades, we add a filter in the form of an ATR oscillator with a moving average calculated from it. The default ATR period is set to five, and the moving average period smoothing it is set to three.
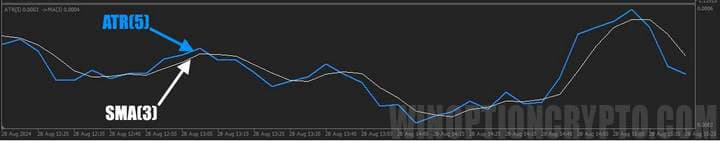
The purpose of this filter is to identify periods of increasing volatility — when the price begins to move actively in one direction — and to avoid flat conditions where possible. As a rule, when the ATR oscillator line is above its moving average, the market is trending; when the ATR line falls below its moving average, the market is in a flat and trading that asset is not recommended.
Opening a Call Option
- The green MA RIBBON cloud indicates a bullish trend.
- The "Call pattern" has formed.
- The ATR is above its moving average.
- Open a Call option at the start of the next candle.
Opening a Put Option
- The red MA RIBBON cloud indicates a bearish trend.
- The "Put pattern" has formed.
- The ATR is above its moving average.
- Open a Put option at the start of the next candle.
The recommended expiration time is 3 candles. The optimal holding period can be refined through backtesting on historical data.
Specifics of Using the MA RIBBON Indicator
In addition to the patterns described above, modified versions of them — or both pattern types simultaneously — can be used to open positions, depending on the win-rate statistics for the specific asset being traded.
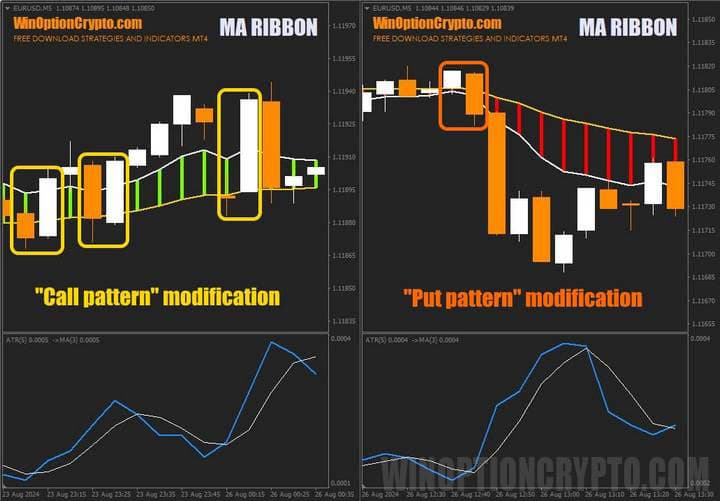
In the modified Call and Put patterns, you wait for a candlestick combination where the previous candle closed on one side of the cloud and the current (most recent) candle closed on the other. These combinations appear frequently during breakouts from flat conditions, when the moving averages forming the cloud converge due to a narrow difference in their values. Before using these additional patterns in live trading, we recommend testing them on historical data.
Advantages of the MA RIBBON Indicator
The main advantage of the MA RIBBON indicator is its clear trend visualisation. The distinctly coloured clouds allow even a novice trader to identify the preferred trade direction at a glance. The available settings make it possible to optimise the calculation parameters for both moving averages, allowing the indicator's signals to be tailored to a specific currency pair or cryptocurrency.
Disadvantages of the MA RIBBON Indicator
The main drawback is the high number of false signals generated during flat market conditions. To reduce losing trades, we recommend using the MA RIBBON indicator alongside other confirming indicators as a filter.
Conclusion
The MA RIBBON indicator is a strong alternative to simple moving averages. Its distinctive colours make it easy to identify the preferred direction for opening trades without confusion. The tool will particularly appeal to trend-following traders, as it is built on the same classic moving averages that have become the standard for trend analysis.
Since the MA RIBBON indicator is completely free, traders can apply it to any strategy and adapt its signals to their needs. We recommend using it alongside other indicators and maintaining a disciplined approach to capital and risk management. Before using it in live trading, be sure to practise on a demo account with a reliable broker. We wish you profitable trading!
Download MA RIBBON

To leave a comment, you must register or log in to your account.