The Atomic Analyst binary options indicator is a new tool for traders working on the MetaTrader 4 platform. It not only generates trading signals, but also provides an information panel with various statistical data. This allows traders to move beyond blindly following the indicator's recommendations and instead conduct a deeper analysis of their effectiveness, track trend direction, and assess the probability of a successful trade.
The Atomic Analyst indicator collects statistics on its own signals, giving users the opportunity to develop an individual trading strategy. In this review, we examine the functionality of this paid indicator in detail, analyze its advantages and disadvantages, and walk through examples of its use in real trading. Its price is $199, but you can download it free of charge from the link at the end of this review for informational purposes. Find out how this tool can improve your performance in the binary options market and help you achieve more consistent profits.
Content:
- Key Features
- Installation
- Overview and Settings
- Trading Rules for Atomic Analyst
- Opening a Call Option
- Opening a Put Option
- Conclusion
- Download Atomic Analyst
Key Features of the Atomic Analyst Indicator
- Terminal: MetaTrader 4
- Timeframe: M5
- Expiration: 3 candles
- Option Types: Call/Put
- Indicators: Atomic Analyst.ex4
- Trading instruments: currency pairs, commodities, cryptocurrencies, stocks
- Trading hours: 08:00–21:00 UTC
- Recommended brokers: Quotex, Pocket Option, Binarium
Installing the Atomic Analyst Binary Options Indicator
The Atomic Analyst indicator is installed in MetaTrader 4 using the standard procedure. Open MetaTrader 4, select "File", then "Open Data Folder". In the directory that opens, navigate to the "MQL4" folder, then to "Indicators", and move all the files there. Templates are installed in the same way, but are placed in the "Templates" folder instead. For a more detailed walkthrough, please refer to our installation video below:
Overview and Settings of the Atomic Analyst Binary Options Indicator
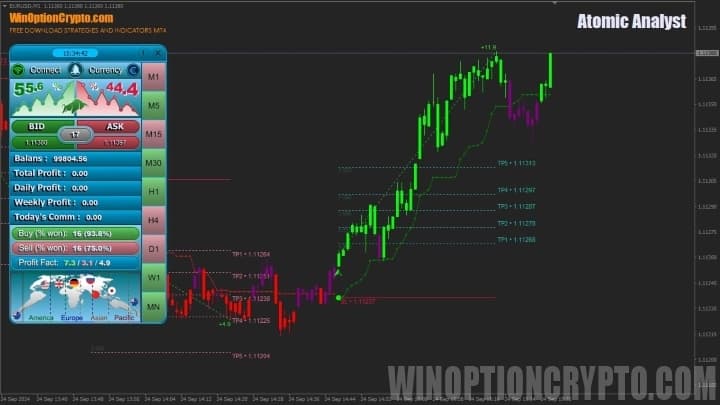
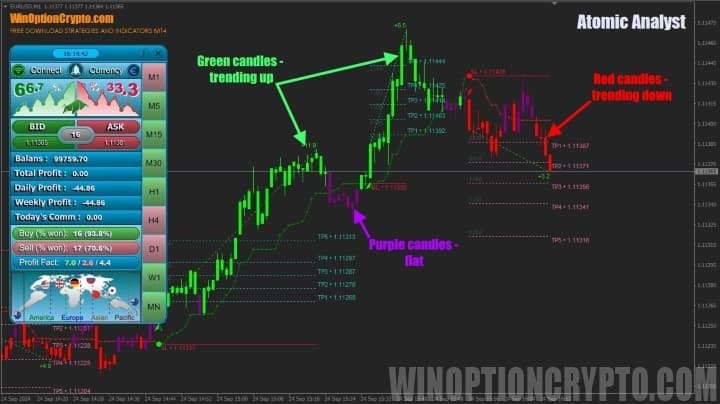
The Atomic Analyst binary options indicator is a comprehensive market analysis system. Rather than displaying classic Japanese candlesticks or bars, it plots a proprietary chart type: green candles indicate an upward trend, red candles indicate a downward trend, and purple candles signal a sideways market.
In addition to the trend candles, the Atomic Analyst indicator displays profit-taking levels on the chart, which will also be useful for Forex traders. The green dotted line marks take-profit levels for long trades, while the red dotted line marks take-profit levels for short trades.
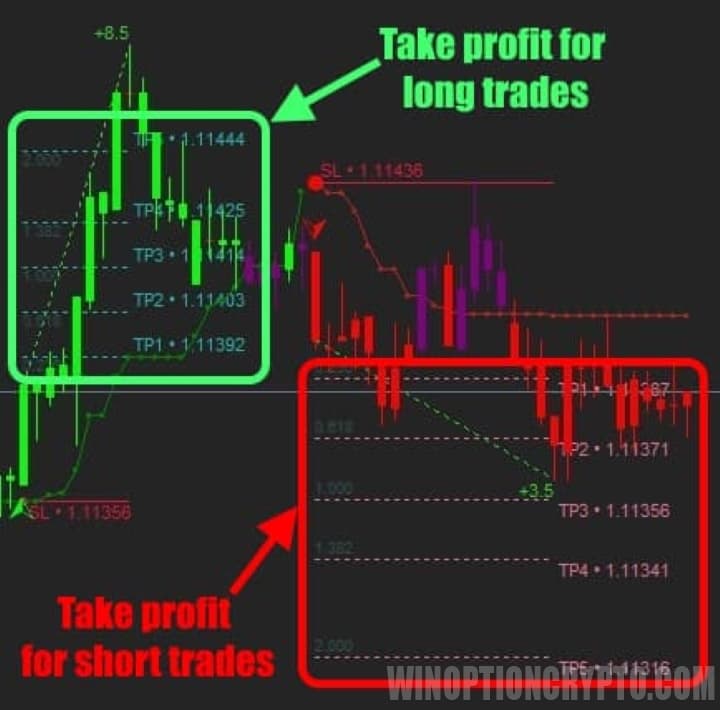
The choice of a specific level depends on each trader's preferences and risk tolerance. Keep in mind, however, that the probability of price reaching TP-4 and TP-5 is significantly lower than for TP-1 through TP-3. Factor this into your trading decisions.
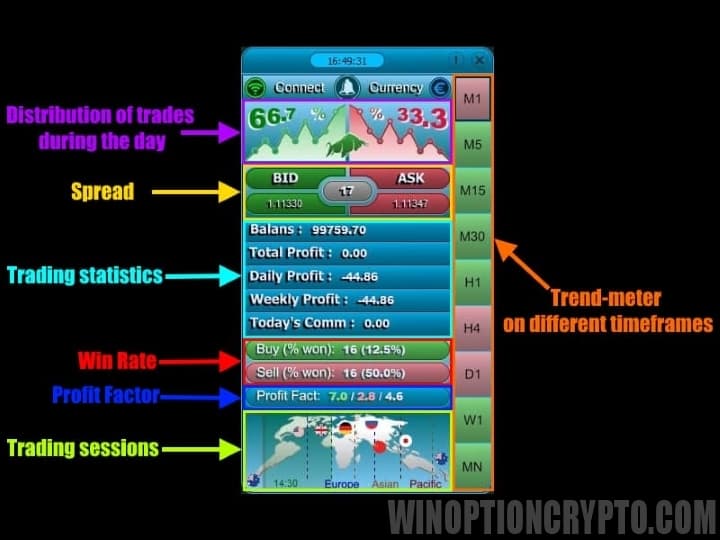
The core element of the Atomic Analyst binary options indicator is its information panel. It allows traders to see the distribution of trades by direction for the day, the current spread, account trading statistics, the win rate for buy and sell trades separately, and the overall profit factor for the day's trading signals — broken down by buys and sells as well. The panel also displays the current trading session and a trend meter showing trend direction across multiple timeframes.
This indicator is feature-rich, so it naturally comes with a wide range of settings. We will not cover every parameter here, as most are self-explanatory.
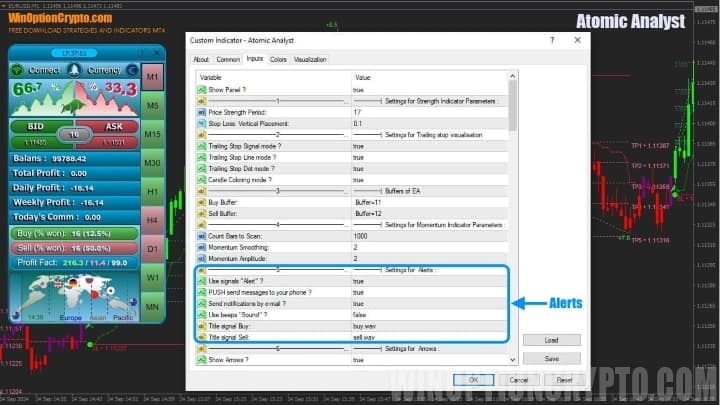
We want to draw your attention specifically to the alerts section. With alerts enabled, traders no longer need to monitor the market and the Atomic Analyst indicator's signals continuously.
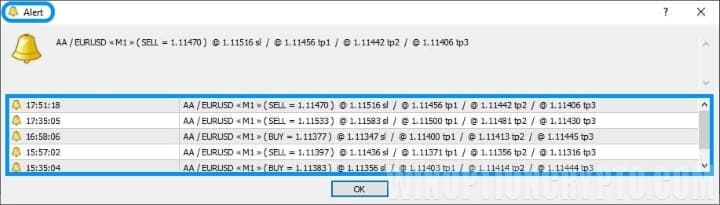
Once all the required conditions are met, a trading signal appears on the chart — a green triangle to open a Call option, or a red triangle to open a Put option — accompanied by a pop-up alert.
Trading Rules for the Atomic Analyst Binary Options Indicator
The Atomic Analyst binary options indicator should be used in the direction of the prevailing trend. The market trend is determined by reading the trend meter in combination with the win rate statistics. For example, in the screenshot below you can see that most timeframes on the trend meter are highlighted in green, indicating an uptrend.
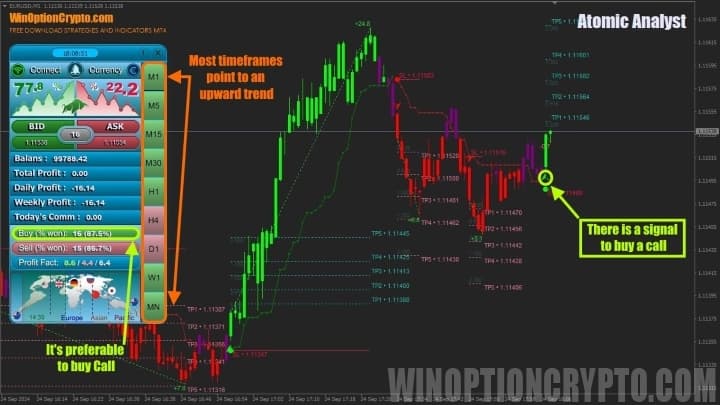
At the same time, the win rate for Call option trades is higher than for Put trades. This confirms the uptrend and points to the preferred trading direction. The trader simply needs to wait for a buy signal — a green triangle beneath a green candle — and ignore any Put signals in the meantime.
Regardless of the signals a trading strategy generates, traders should always pay close attention to money management principles, as these can cushion the impact of losing streaks that every trader experiences from time to time, regardless of their level of experience. If you want to keep your losses under control and know how to act even in the most difficult situations, we recommend reading our articles on the subject:
- Capital Management: Principles of Money Management
- How to Keep Losses Under Control: Risk Management
- Psychology and Trading Discipline
- The Trader's Journal as a Tool for Refining Trading Strategies
When trading with the Atomic Analyst binary options indicator, it is recommended to risk no more than 2% of your capital per trade.
Opening a Call Option
- Confirm that the market is in a bullish trend — most timeframes on the trend meter are green.
- The "Buy % Won" value on the information panel is above 80%.
- A green triangle appears beneath a green candle.
- Open a Call option at the start of the next candle.
Opening a Put Option
- Confirm that the market is in a bearish trend — most timeframes on the trend meter are red.
- The "Sell % Won" value on the information panel is above 80%.
- A red triangle appears above a red candle.
- Open a Put option at the start of the next candle.
The recommended expiration time is 3 candles. We advise you to calibrate the holding period based on backtesting results on historical data.
How to Get the Most Out of the Atomic Analyst Binary Options Indicator
It is recommended to use the Atomic Analyst binary options indicator on assets with a high win rate in the direction of the dominant trend. In this way, the trader has not only a theoretical basis for trading with the trend, but also concrete confirmation in the form of the recorded win rate.
It is worth noting that the specific win rate threshold to use when selecting a trading direction is ultimately a matter of personal preference. The 80% figure used in this article serves as a guideline rather than a strict rule. Keep in mind that markets are dynamic — what performed well yesterday may produce average results today. The key is to understand the underlying trading logic and apply it appropriately for the asset and timeframe you are using.
Pros of the Atomic Analyst Indicator
One of the main advantages of this technical analysis tool is its built-in signal statistics, which give traders advance insight into whether trading a specific asset on a given timeframe is worthwhile. The combination of a clear information panel and a trend meter covering multiple trading intervals makes your trading more informed and consistent.
Another clear advantage is ease of use. All you need to do is identify an asset with an aligned trend across multiple timeframes and a high win rate in that direction — then simply wait for the appropriate signal and open a trade.
Disadvantages of the Atomic Analyst Indicator
The main drawback of this tool is that it can require a lengthy wait for all trading conditions to align. This is particularly noticeable with binary options brokers that offer a limited range of assets. In such cases, you can try switching to a different timeframe and evaluating the indicator's signal quality there.
Conclusion
The Atomic Analyst binary options indicator is a well-designed combination of trend analysis and trading statistics. While the trend component improves the probability of profitable trades, the statistical data either confirms or challenges those assumptions. Used thoughtfully, these two principles can deliver solid results with this paid indicator. Its $199 price tag is reasonable, though not the lowest on the market.
We invite you to try it out by downloading it free of charge for informational purposes using the link below this review. Before using it in live binary options trading, test the Atomic Analyst indicator's signals on a demo account with a reliable broker with a low minimum deposit. Only after verifying its effectiveness should you proceed to trading with real funds — and always in accordance with risk and capital management principles. We wish you successful trading!
Download the Atomic Analyst Binary Options Indicator

To leave a comment, you must register or log in to your account.