
The TradingView trading platform launched in 2011 with a clear mission: to unite the trading community in one place. This approach made it possible to exchange information, share market insights, communicate with other traders, and thereby improve trading skills. The platform supports analysis across multiple markets, and its functionality covers binary options, Forex, equities, and derivatives.
The TradingView team has offices around the world, with its main headquarters in New York and a significant European presence in London. The platform is available in over 20 languages, with English remaining the most widely used.

Contents:
- Features and advantages of the Trading View trading platform.
- Review of the TradingView trading platform.
- Trading assets on the TradingView platform.
- Time frames on the Tradingview platform.
- Types of charts on the TradingView platform.
- Indicators and strategies on the TradingView platform.
- Chart overlay on the TradingView platform.
- Graphical tools on the TradingView platform.
- Fundamental and technical information on the TradingView platform.
- Trading ideas and forecasts for traders on the TradingView platform.
- Paid features of the TradingView platform.
- Conclusion.
Features and Benefits of the TradingView Trading Platform
It is no coincidence that TradingView is widely recognized as one of the best platforms for market analysis. Using this service, you can:
- Conduct advanced technical analysis using the platform's extensive range of graphical tools, indicators, and strategies.
- Select and filter trading assets using a screener.
- Track a wide variety of financial news and economic indicators, including statistics and company financial reports.
- Execute live trades after connecting a brokerage account.
- Communicate and share your ideas or forecasts with other traders.
- Customize chart colors and visual settings.
- Create custom indicators using the built-in Pine Script™ editor.
More and more traders are choosing TradingView for analysis and even active trading, as the standard MetaTrader 4 terminal cannot match its breadth of functionality. Many well-known financial websites also embed TradingView charts directly into their portals.
Overview of the TradingView Trading Platform
Although TradingView is browser-based, this does not make it comparable to the clunky, limited web platforms offered by some brokers. Its functionality is rich and varied.
You can use the platform both on our website in the section — Live Chart — and on the official website tradingview.com.
The main advantages of TradingView include:
- A convenient and intuitive interface that, even in the free version, outperforms many dedicated terminals.
- Access to the TradingView service from anywhere with an internet connection.
- All settings and graphical elements are saved to a free cloud server.
- Additional functionality for advanced users.
The platform is divided into several convenient blocks, each containing the core tools for analysis and trading:
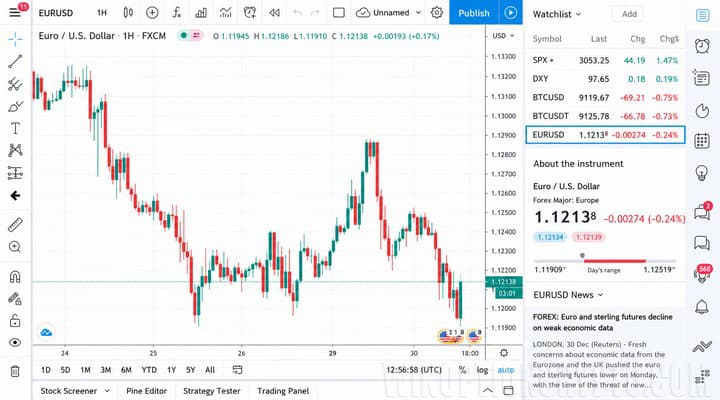
As you can see, graphical tools are located on the left, trading assets and instrument information on the right, and the top bar contains indicators, strategies, timeframe switching, and other display options. At the bottom, you will find a time panel, screener, code editor, strategy tester, and trading panel.
If you need to change any visual settings or add and remove certain elements, this can be done through the settings menu:
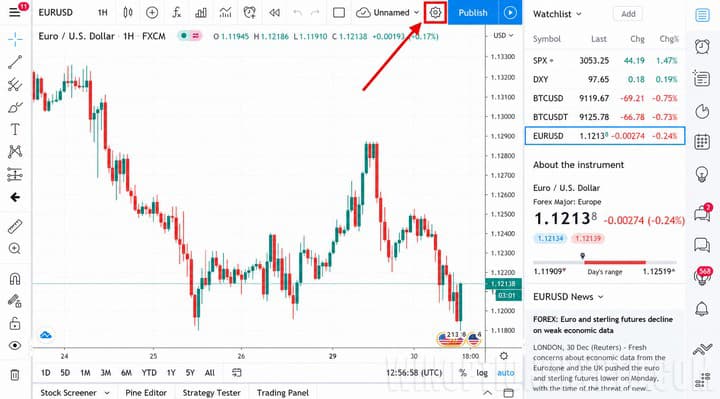
Trading Assets on the TradingView Platform
On TradingView you can view and analyze charts for virtually any trading instrument available in the world. You can add the required asset to your watchlist or search for it directly:
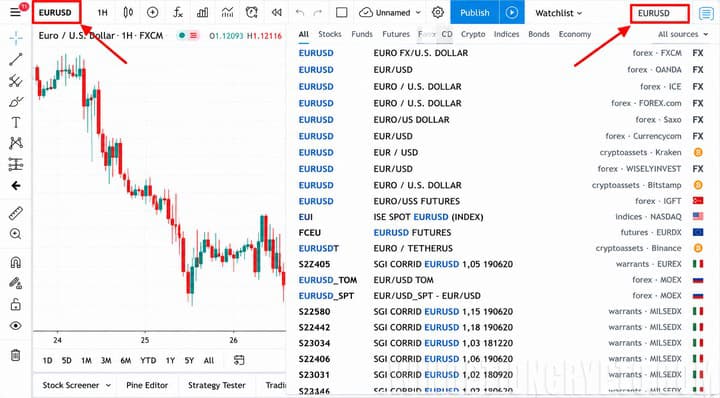
As you can see, the platform displays the EUR/USD chart with quotes from different brokers. The same applies to any other asset, whether stocks, futures, or cryptocurrencies.
Time Frames on the TradingView Platform
The TradingView service lets you analyze a wide range of timeframes:
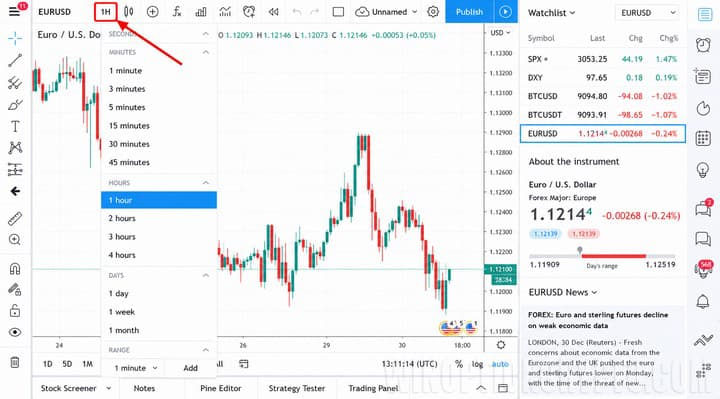
Paid subscribers also have access to any custom time interval, as well as tick and range charts.
Types of Charts on the TradingView Platform
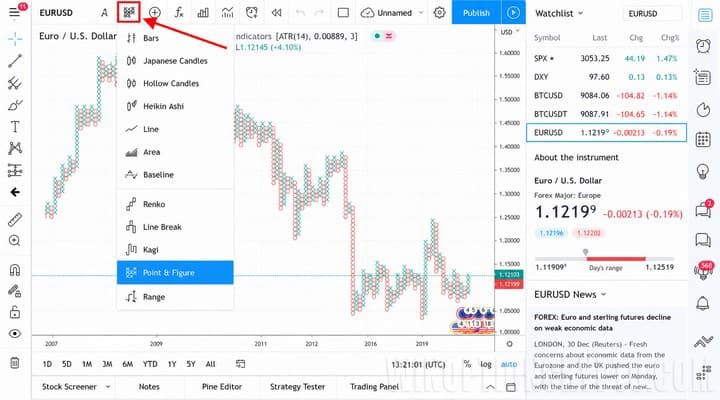
TradingView offers a wide selection of chart types. In addition to standard bars and candlesticks, you can choose from a range of more specialized displays, including a Renko or Point & Figure chart:
Indicators and Strategies on the TradingView Platform
You can add a wide variety of indicators to any chart — TradingView offers far more built-in options than most other terminals:
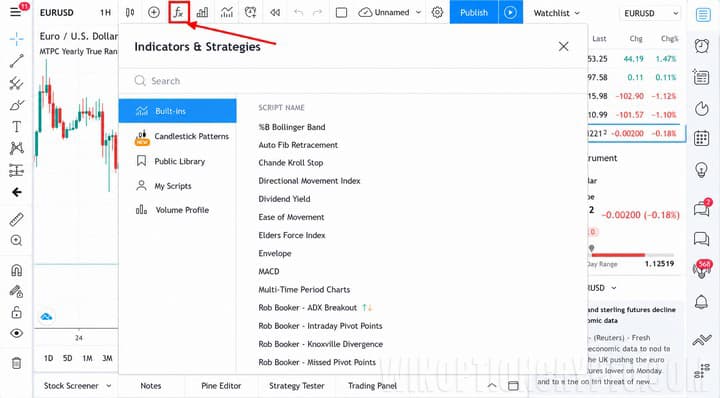
In addition to standard indicators such as RSI, Stochastic Oscillator, MACD, and CCI, you can also use candlestick pattern indicators, as well as Volume Profile (available with a paid subscription):
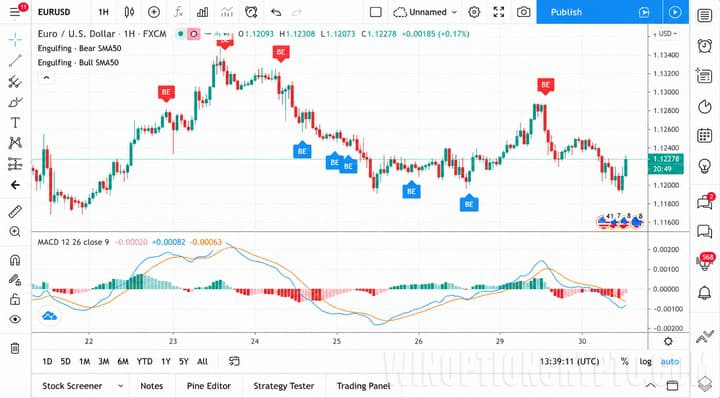
In addition to building your own trading strategies, you can use ready-made options. Community-authored indicators and strategies created by other traders and developers are also available to all users and can be found on the indicator panel under the "Community Scripts" tab.
Chart Overlay on the TradingView Platform
Overlaying charts on TradingView does not require any additional indicators, as this is a built-in feature of the platform:
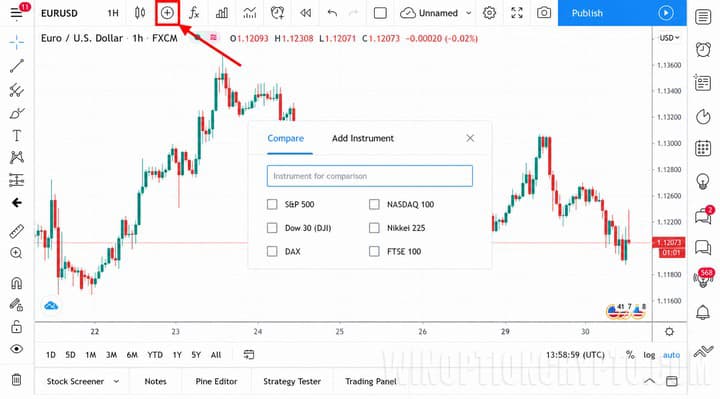
You can add virtually any trading asset to the chart for comparison:
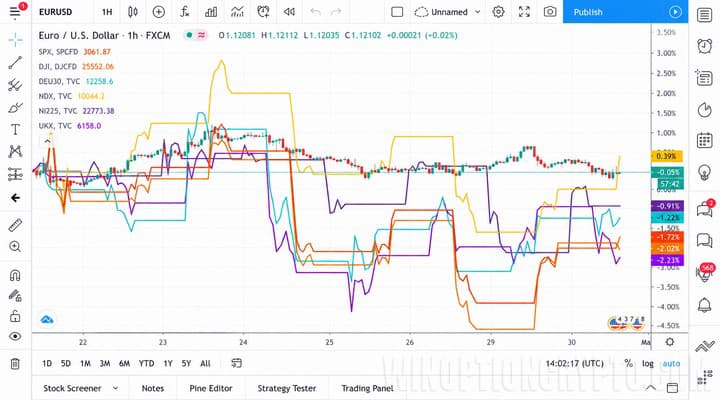
This can be used not only to track currency pair correlations, but also to build a diversified portfolio of assets — for example, a mix of stocks and bonds.
Graphical Tools on the TradingView Platform
TradingView has an extensive arsenal of graphical tools that will satisfy even the most demanding analyst. Available on the platform:
- All types of lines and channels (rays, regressions, guides).
- Gann and Fibonacci tools (arcs, circles, spirals, fans, extensions).
- Geometric shapes (rectangles, triangles, polygons).
- Elliott Wave tools (waves, cycles, patterns).
- Forecasting tools (ranges, projections).
- Annotation marks and icons.
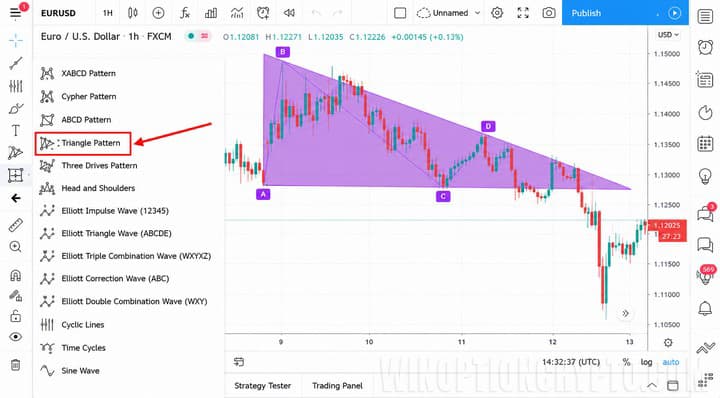
For traders who work with chart patterns, TradingView includes a "Triangle" drawing template that simplifies the process of marking this formation:
Fundamental and Technical Information on the TradingView Platform
On the right side of the TradingView chart, you will find a panel containing a watchlist, economic calendar, market overview, chat, alerts, and much more.
In the watchlist, you can view key information about the selected asset:
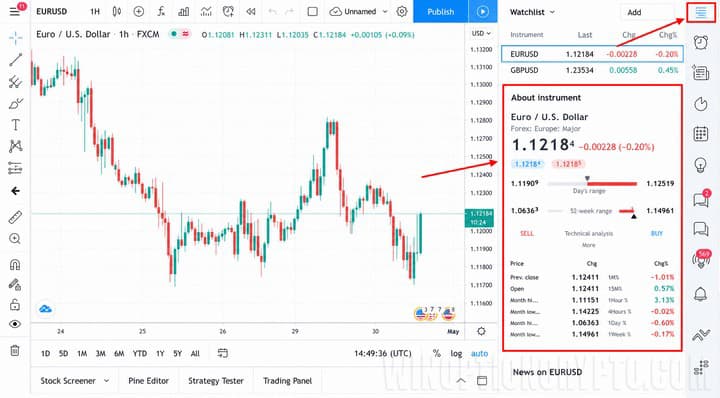
In this case, it is EUR/USD — the panel displays the current price, daily change, trading session, daily price range, and 52-week range. Additional technical information is available via the "More" button.
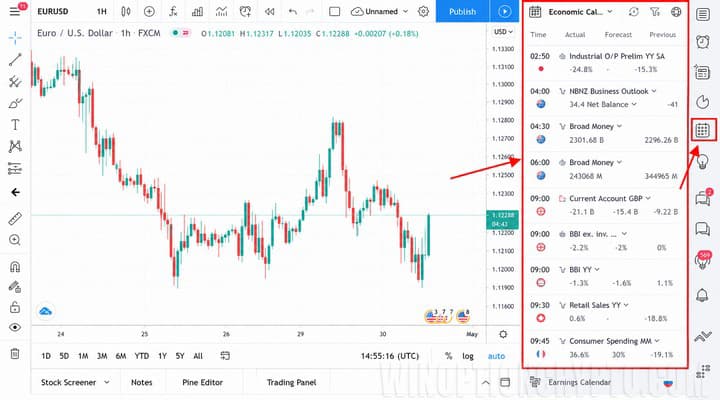
The economic calendar shows past, present, and upcoming macroeconomic events:
The TradingView chat is organized by specific markets and instruments:
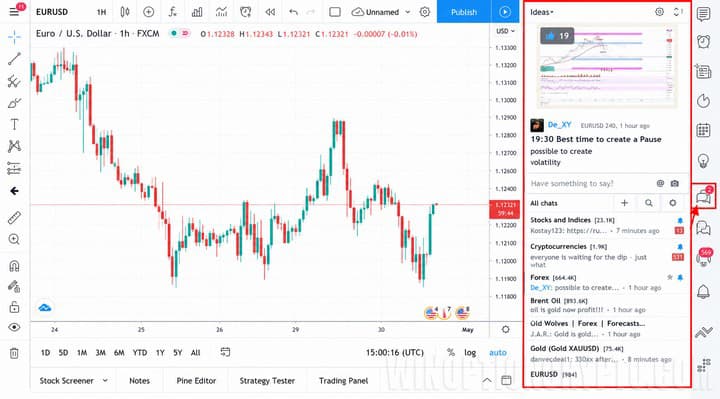
Currency traders can use the Forex chat, while cryptocurrency enthusiasts can join the Bitcoin chat, for example.
TradingView also includes a screener for filtering and selecting assets across equities, Forex, and cryptocurrency markets:
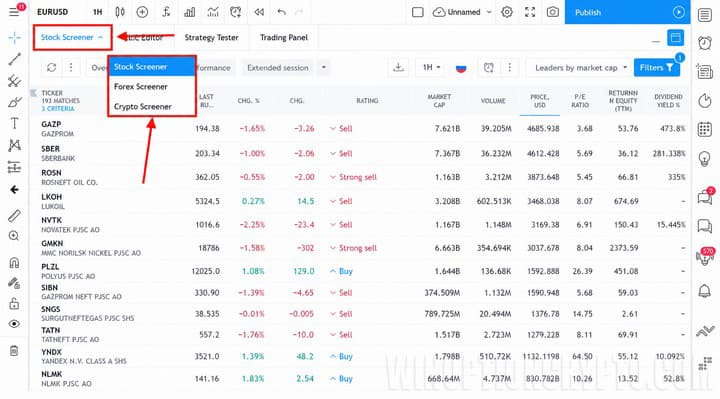
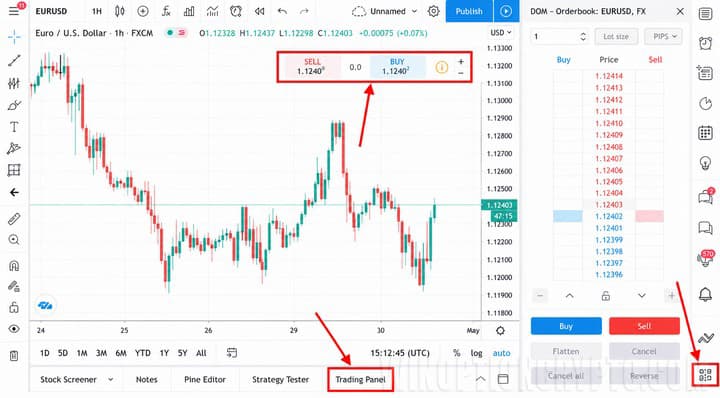
If you have connected a brokerage account to TradingView, go to the "Trading Panel" tab at the bottom to start trading. Orders can be placed either through the trading panel or via the order book accessible from the right-side panel:
Trading Ideas and Forecasts on the TradingView Platform
Community interaction is central to what TradingView was built for, which is why the platform's main page features a wealth of ideas, analyses, and forecasts from traders worldwide.
The Ideas tab is divided into different sections:
- Asset class.
- Trend analysis.
- Harmonic patterns.
- Chart patterns.
- Indicators.
- Wave analysis.
- Gann.
- Beyond technical analysis (trading psychology, etc.).
After selecting a section, you can start browsing forecasts:
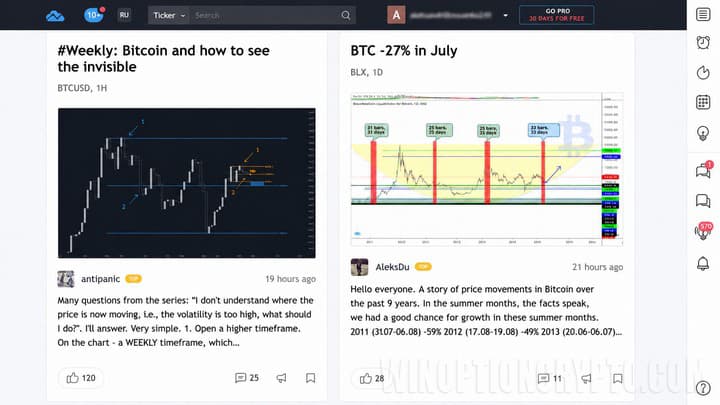
Once you have reviewed a forecast, you can replay it to see whether it played out. To do this, click the "Play" button:
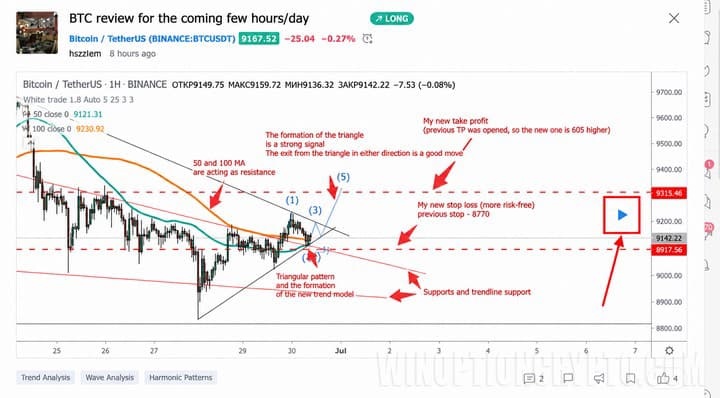
Once enough time has passed, the data updates and you can observe how the situation developed:
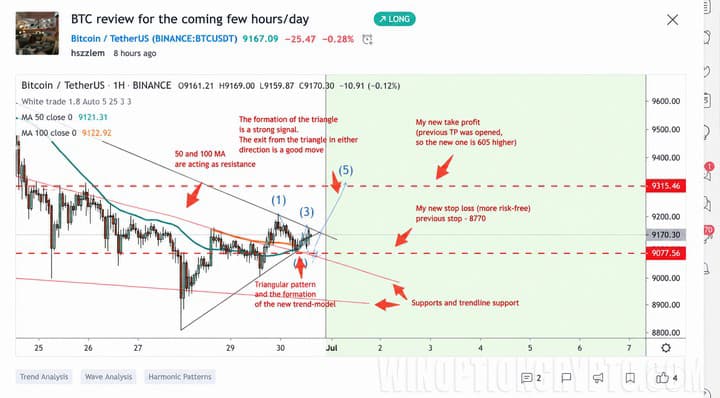
Any trader can publish their own ideas or forecasts. A key advantage of the platform is that published forecasts cannot be edited after the fact — meaning that when you study the work of other traders, you can immediately see who genuinely understands the markets and who does not.
Paid Features of the TradingView Platform
TradingView also offers additional functionality through paid subscription plans. With a "Pro" subscription, users can:
- Open multiple charts simultaneously.
- Use an unlimited number of indicators on a single chart (limited in the free version).
- Use Volume Profile.
- Access real-time volume data.
- Receive real-time quotes from global exchanges for futures and ETFs.
- Remove advertising.
Conclusion
Having explored everything TradingView has to offer, it is clear that among free and widely used alternatives, it is hard to find a terminal or platform more capable. Anyone who plans to trade on the Forex market or in binary options will benefit from using this service for analysis, community interaction, and developing their trading skills.

See Also:
- How to make money on binary options
- Types of binary options
- Deposit size for binary options trading
- Pros and Cons of Binary Options Trading
To leave a comment, you must register or log in to your account.