Volumes in binary options trading allow traders to assess the market more broadly and identify the most accurate entry points for buying options. However, analysis does not have to rely solely on vertical volumes, as they do not always indicate market direction — making a binary options strategy based on cluster analysis a more practical alternative.
What Is Cluster Analysis for Binary Options?
In the early days of stock trading, only line charts were available — displaying the current price with no way to see highs, lows, opens, or closes. This was not particularly convenient, and bar charts eventually replaced them. Bars made it easy to identify key price values at a glance, but candlestick charts took this further, making it even easier to read market behaviour through their bodies and wicks.
In more recent times, new methods of displaying price have emerged, one of which is the cluster chart for binary options — the foundation on which this strategy is built:
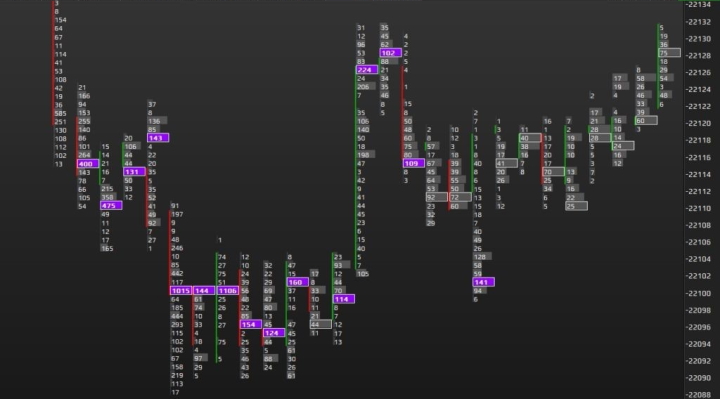
One advantage of this strategy is that real volume data is not required — tick volumes are sufficient.
In general, a high volume reading in trading most often indicates the presence of large institutional players in the market, which allows traders to buy options in the direction of the significant open positions held by so-called "smart money".
There are two primary methods for measuring volume:
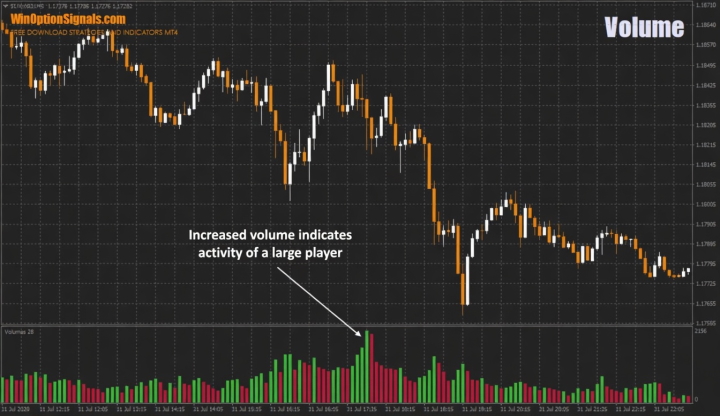
- Vertical volume.
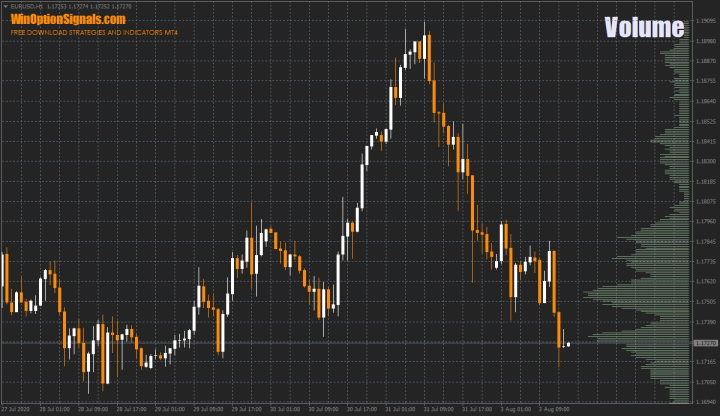
- Horizontal volume.
Vertical volume is measured within a single candle or bar. An elevated reading indicates that a major market participant is active. On the chart, this type of volume is displayed as a histogram:
Horizontal volume, by contrast, is measured by price level rather than by time. This makes it possible to identify significant price zones that are of interest not only to large players, but also to retail traders. These zones most often become support and resistance levels. This type of volume appears as follows:
A strategy using cluster analysis in binary options trading is more precise than one relying on standard volumes, as it shows horizontal volume for every minute, hour, day, and so on. This approach allows traders to identify key price levels without relying on third-party indicators for binary options, and those levels are always grounded in actual trading activity at the corresponding price. A standard price display shows only what has already happened, whereas cluster analysis reveals the balance between buyers and sellers — providing direct insight into market sentiment. In this sense, studying a cluster gives the trader a view of the "skeleton" beneath the candle.
How to Use Cluster Analysis for Binary Options
To get started with cluster analysis for binary options and this strategy, you will need to download and install two indicators for the MetaTrader 4 trading platform:
- VP V6.
- VP Range.
The first indicator builds a volume profile (clusters) for specified time periods, while the second builds a composite volume profile covering a longer period, such as a week or a month.
It is worth noting that although both indicators support cluster building based on real volume, tick-based data will be used in practice, since Forex brokers and binary options brokers do not provide access to real volume data.
VP V6 Indicator and Cluster Analysis for Binary Options
The VP V6 indicator builds clusters and volume profiles for defined time periods. For example, daily clusters can be overlaid on an hourly chart:
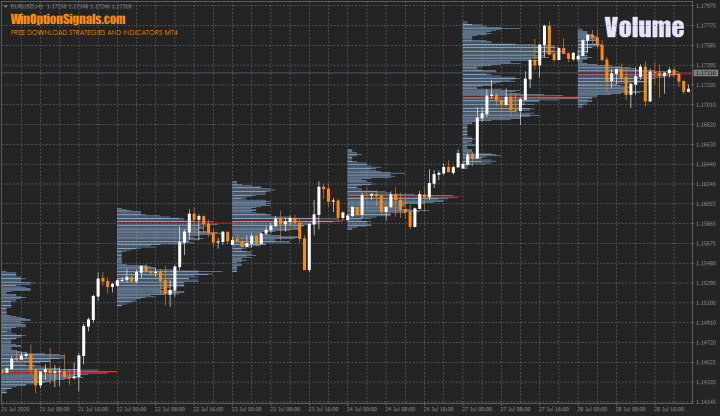
This makes it possible to identify the key price levels formed during the day, and the same cluster approach can be applied to any timeframe. In the example below, the EUR/USD pair is shown on the M15 chart, where a period of consolidation at the top was supported by a significant volume accumulation:
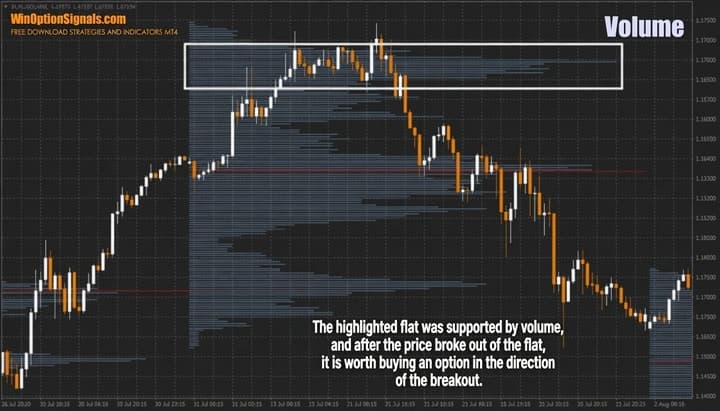
Following a breakout of such a consolidation zone, a Put option purchase is warranted.
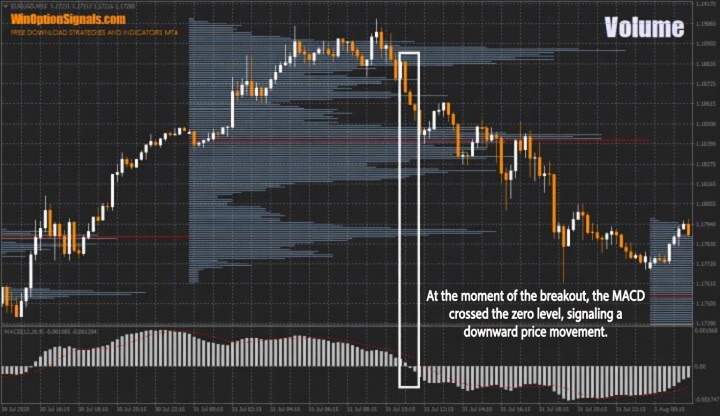
This approach also allows for the addition of other indicators to support trading decisions. Using the same chart area with the MACD indicator added, it is clear that at the moment of the consolidation breakout, MACD also generated a Put option signal:
Shorter timeframes can also be used to identify short-term levels for quick trades. The analytical principles remain the same, but before applying this approach on M1 and M5 charts, it is strongly recommended to test it on a demo account first — turbo options can rapidly erode accumulated profits or deplete a deposit.
VP Range Indicator and Cluster Analysis for Binary Options
Instead of individual clusters, a composite market profile can also be used. Such a profile is built over a longer period (a week or a month) and then analysed in the same way.
The example below shows the market profile for one trading week. After the price broke out of a consolidation zone — where volume was also present and a Call option purchase was worth considering — the price pulled back and found support precisely at the highest-volume level:
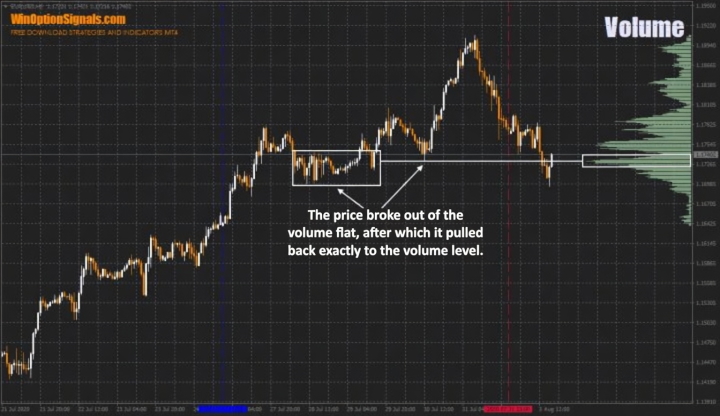
When price approaches such levels, the probability of a bounce is high — as demonstrated in this case. This was another valid point to buy a Call option.
Trading Platforms for Cluster Analysis in Binary Options
A number of platforms are available for volume analysis:
- TradingView.
- NinjaTrader.
- Volfix.
- ATAS.
- SB Pro.
However, all of these platforms are paid and may not be the best fit for those new to binary options trading, both because of the cost and the complexity of configuration. Free alternatives that work with tick volumes are a practical starting point, as even tick-based data is sufficient to begin trading binary options profitably.
Each of these platforms also offers free demo access, which allows traders to evaluate whether a given platform suits their needs before committing.
Conclusion
A cluster analysis-based strategy for binary options makes it possible to identify key price zones and determine which side — bulls or bears — is currently in control. This information can be incorporated into binary options trading as a standalone method or used to complement an existing system with volume-based analysis.
It is important to remember that any binary options trading strategy must be verified and tested before use in live trading, and that money management and risk management should never be overlooked.

To leave a comment, you must register or log in to your account.