The Volume Delta binary options indicator analyses the balance of power between buyers and sellers at a given price level. Its operation is based on a simple but effective principle: when buyers dominate, prices tend to rise; when sellers dominate, prices tend to fall.
In this review, we will look at the key features of the Volume Delta indicator, explain how to interpret its trading signals, and show how to use them to assess the potential of each trade.
Contents:
- Key Features
- Installation
- Overview and Settings
- Volume Delta Trading Rules
- Specifics of Application
- Conclusion

Key Features of the Volume Delta Indicator
- Terminal: TradingView
- Timeframe: M1
- Expiration: 3 candles
- Option Types: Call/Put
- Built-in indicators: Volume Delta [hapharmonic]
- Trading instruments: currency pairs, commodities, cryptocurrencies, stocks
- Trading hours: 08:00–21:00 UTC
- Recommended brokers: Quotex, Pocket Option, Binarium
Installing the Volume Delta Binary Options Indicator
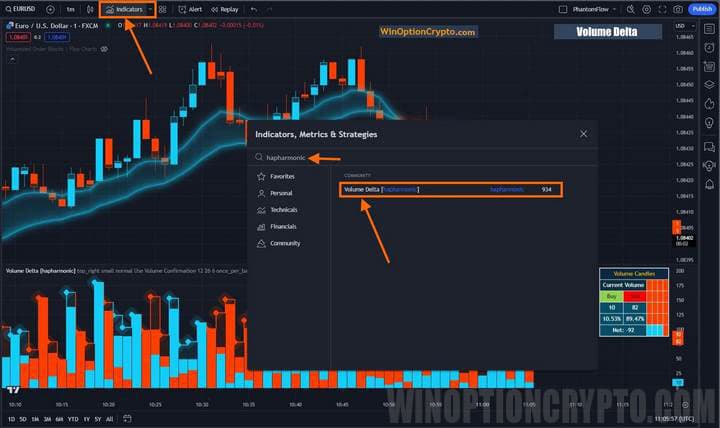
The indicator is installed in TradingView via the "Indicators" button at the top of the platform. Clicking it opens the "Indicators, Metrics and Strategies" panel. In the search bar, enter the developer's name — hapharmonic — then find the indicator in the list that appears and click on it, making sure the name reads "Volume Delta."
Volume Delta Indicators: Overview and Settings
The Volume Delta indicator available on the TradingView platform is completely free, yet more effective than many paid commercial tools. It works by measuring the balance between buying and selling pressure within a single candle, giving traders a clear picture of who is currently in control of the market: buyers or sellers.
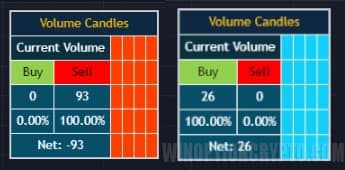
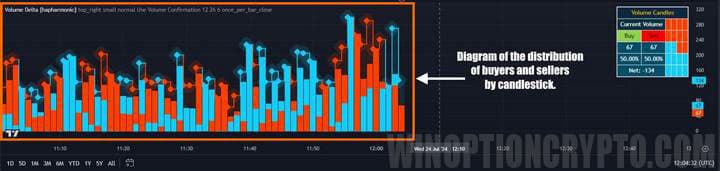
The screenshot above shows the Volume Candles dashboard, which displays real-time data on the number of buy and sell trades, as well as their delta — the difference between the two. This information helps binary options traders identify potentially profitable moments to enter trades in the direction of the prevailing delta, following the stronger market force. The dashboard is displayed at the bottom of the chart, alongside a bar chart showing how buying and selling pressure is distributed within each individual candle.
Looking closely at the chart on the left, you will notice that candles where buyers dominated are fully blue, while those where sellers dominated are red. Candles with no colour indicate a neutral balance.
The Volume Delta indicator therefore provides information not only on the total volume traded per candle — which can be estimated from the height of the histogram bar — but also on the proportion of buys versus sells within that candle. This allows traders to assess market sentiment and the potential for price movement more effectively.
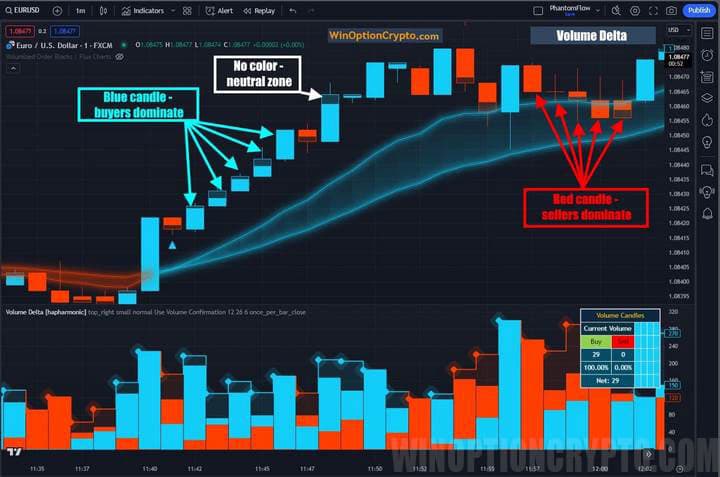
The display logic is straightforward: the candle body (the area between the open and close prices) represents 100% and is filled with colour in proportion to the dominant force — buyers or sellers. This approach visualises real market sentiment by calculating the difference between the volume of completed buy and sell transactions.
Under the hood, Volume Delta uses two exponential moving averages with periods of 12 and 26, both of which can be adjusted in the indicator settings.
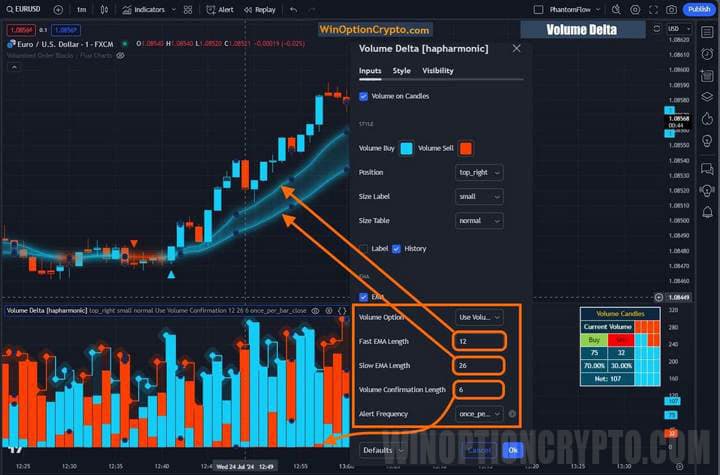
The "confirming volume" threshold is also configured in the settings; this controls when arrows appear at moving average crossovers, and it is where alerts are set up. The purpose of the "confirming volume" is to ensure that a crossover arrow only appears when the volume in the direction of the cross exceeds the threshold specified in the settings.
Trading Rules for the Volume Delta Indicator
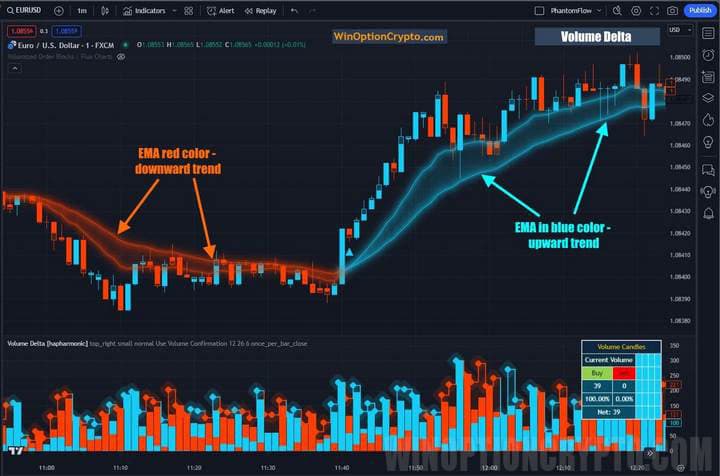
Trading with the Volume Delta indicator follows a trend-based approach, with trend direction determined by the position and crossover of the moving averages relative to each other. In a bullish trend, the short EMA (period 12) crosses above the long EMA (period 26). When this occurs, the moving averages are highlighted in blue; when sellers take control, they turn red.
Moving averages are fundamental technical analysis tools. To learn more about how they work and how to use them in trading, see our selection of articles on the topic:
- Technical Analysis of Binary Options
- Technical analysis of cryptocurrencies
- Autochartist: Technical Analysis on Automation
- Book by D. Murphy "Intermarket Technical Analysis"
Opening a Call Option
- Confirm a bullish trend — EMA is blue.
- The candle is blue and touches the upper EMA.
- The Volume Delta oscillator is entirely blue.
- At the opening of the next candle, buy a call option.
Opening a Put Option
- Confirm a bearish trend — EMA is red.
- The candle is red and touches the lower EMA.
- The Volume Delta oscillator is entirely red.
- At the opening of the next candle, buy a put option.
We recommend setting the expiration time to 3 candles. The optimal holding period should be determined based on backtesting results.
How to Use the Volume Delta Indicator Effectively
Please note that the triangular marker signals generated by the Volume Delta indicator are not direct trading calls to action. These markers appear at the point where the short and long EMAs cross. The signals are also filtered by the "Volume Confirmation Length" setting, which defines the minimum volume threshold that must be met — on the buy or sell side — depending on which direction the moving averages crossed.
This strategy tends to perform well during the opening of the European and American trading sessions on the Forex market. If you are not yet familiar with the trading schedule of financial markets, we recommend reading our article "The Best Time to Trade Binary Options," which covers the main trading sessions and the schedule of major stock markets.
Pros of the Volume Delta Indicator
A clear advantage of the Volume Delta indicator is its ability to reveal what happened inside any candle — specifically, which side won the ongoing struggle between supply and demand. If buyers prevailed, the candle will be blue; if sellers prevailed, it will be red.
The balance of power is also clearly visible, since the candle bodies are filled with colour in proportion to the ratio of buyers to sellers at the moment the candle closes. This helps traders identify the market's direction and potential entry points.
The indicator's readings can also be used to confirm signals from other tools. For example, if the RSI indicator signals a buy but the Volume Delta is negative (red candles), this may indicate a false signal.
Disadvantages of the Volume Delta Indicator
One drawback of the Volume Delta indicator is that it does not account for important factors that can drive price movement, such as key news releases and the publication of macroeconomic data. Relying on this indicator alone can therefore lead to losses. Another limitation is the relative complexity of interpreting its signals, which requires some time to learn.
Conclusion
The Volume Delta indicator helps traders read market sentiment and assess the potential of trading opportunities. By measuring the balance between buying and selling pressure at a given price level, it identifies which side is in control. A positive delta means buyers are dominant, making call options more likely to be profitable. A negative delta signals seller pressure, pointing towards put options.
By opening positions in the direction of the prevailing market force, traders can meaningfully improve their ratio of profitable trades and overall trading efficiency. Before trading with real funds, practise on a demo account and choose a reliable broker from the rating on our website. Always apply sound risk and capital management principles. We wish you successful trading!

To leave a comment, you must register or log in to your account.