The Trend Breaker binary options strategy takes an original approach to filtering false signals. Rather than relying on the usual trend indicators, this system uses a standard graphical analysis tool. Read on to find out how to use it correctly to increase the proportion of profitable trades.
Content:
- Characteristics
- Installation
- Overview and Settings
- Trend Breaker Trading Rules
- Specifics of Application
- Conclusion
- Download Trend Breaker
Key Features of the Trend Breaker Strategy
- Terminal: MetaTrader 4
- Timeframe: M5
- Expiration: 3 candles
- Option Types: Call/Put
- Indicators: SMC Traders.ex4
- Trading instruments: currency pairs, commodities, cryptocurrencies, stocks
- Trading hours: 08:00–21:00 UTC
- Recommended brokers: Quotex, Pocket Option, Binarium
Installing the Trend Breaker Strategy
The Trend Breaker strategy indicators are installed using the standard procedure for MetaTrader 4. Open MT4, click File, then select Open Data Folder. In the directory that opens, navigate to the MQL4 folder and then to Indicators, and move all indicator files there. Templates are installed the same way, but placed in the Templates folder. For more detailed installation instructions, watch our video:
Trend Breaker — Overview and Settings
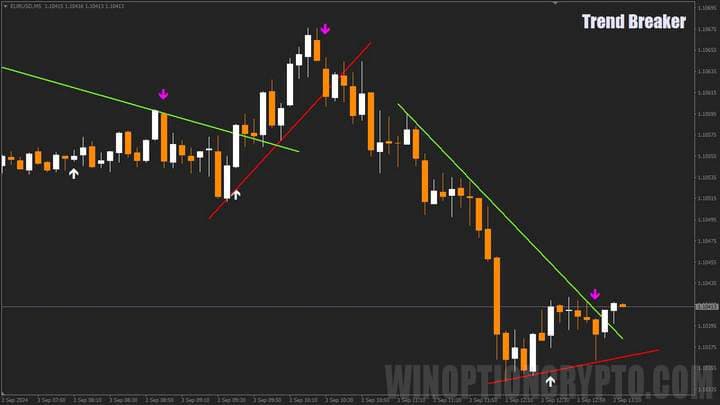
The Trend Breaker strategy uses just one signal indicator alongside the standard graphical analysis tool "Trend Line". The indicator generates signals in the form of white arrows (Call) and purple arrows (Put), while the trend line acts as a filter, eliminating most unprofitable trades.
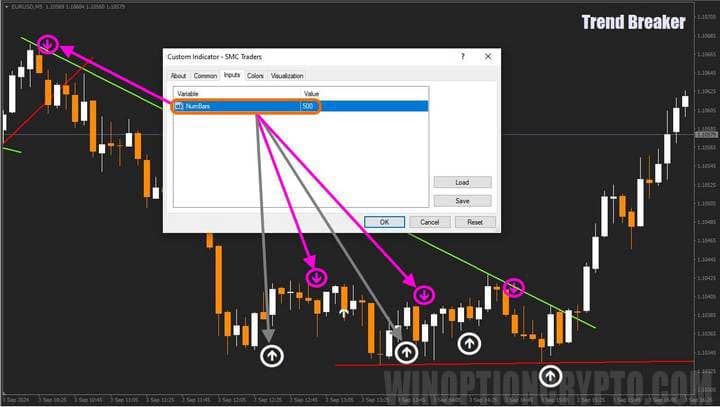
The arrow signal indicator has virtually no configurable settings. The only adjustable parameter is the number of bars displayed on the chart. The signal logic is not disclosed, but the position of the arrows suggests they most likely appear at the moment a short-term price impulse — a swing — reverses.
Aggressive traders may wish to act on every arrow signal, but we do not recommend this approach. Adding a trend filter of your choice significantly improves results. If you are unsure which to use, the article "The Best Binary Options Trend Indicators" covers the most effective options in detail.
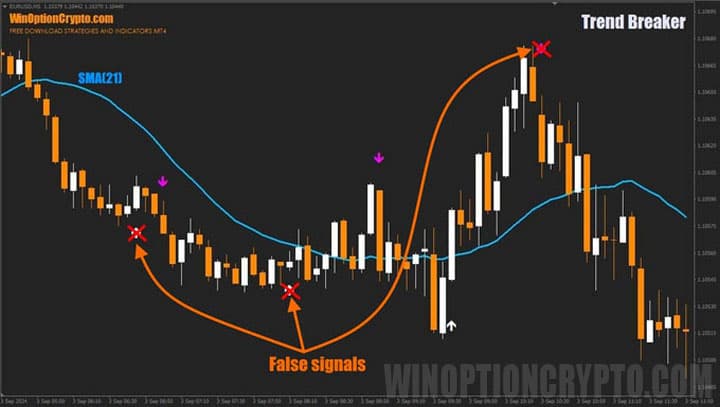
For simplicity, we use a standard simple moving average with a period of 21 candles. As shown in the chart above, applying a straightforward rule — buy Call options when the signal candle closes above SMA(21), and Put options when it closes below — filters out three false signals in the example shown.
Trend Breaker Trading Rules
The Trend Breaker strategy effectively combines graphical analysis with arrow indicator signals. It relies on the trader's ability to draw trend lines correctly on the candlestick chart of the chosen asset. If you are unfamiliar with the principles of constructing technical analysis figures, the following articles are recommended:
- Graphical analysis of binary options
- How to Trade Chart Analysis Figures
- Japanese candlesticks — graphical chart analysis online
- Live cryptocurrency chart online
- Live chart for binary options — free online
As described above, Call options are bought after a white arrow appears below a candle and the signal candle closes above the green line of the bearish trend line. Put options are bought after a purple arrow appears above a candle and the signal candle closes below the red bullish trend line.
Opening a Call Option
- A white arrow appears below the candle.
- The candle closes above the green bearish trend line.
- Buy a Call option at the open of the next candle.
Opening a Put Option
- A purple arrow appears above the candle.
- The candle closes below the red bullish trend line.
- Buy a Put option at the open of the next candle.
The recommended expiration time is 3 candles. Adjust the holding period based on the instrument and backtesting results.
Specifics of Using the Trend Breaker Strategy
The Trend Breaker strategy suits traders who are not satisfied with signals from conventional indicators and who favour the reliability of classical technical analysis. The ability to use a trend line as a filter for trading signals is a genuine strength of this approach — simple as it may appear, it can meaningfully improve trading results.
Pros of the Trend Breaker Strategy
A trend line is one of the simplest yet most widely used tools in technical analysis. Even new traders can use it to determine trend direction quickly, which helps filter out losing trades and supports entering positions in the correct direction. A candle closing beyond a trend line signals a potential reversal point and the possible start of a new trend — a clear and objective condition for trade entry.
Cons of the Trend Breaker Strategy
Trend lines, for all their usefulness, have known limitations: subjectivity in their construction, vulnerability to false breakouts, and the inherent instability of trend movements. The arrow indicator compensates for some of these weaknesses, but does not eliminate them entirely. An additional drawback of the strategy is the absence of alerts when arrows appear — traders must monitor the chart continuously to avoid missing signals.
Conclusion
The Trend Breaker binary options strategy offers an unusual combination of a standard technical indicator and graphical analysis — a pairing that is rarely seen in binary options trading. Using a graphical tool as a signal filter may seem unconventional, but the strategy generates a meaningful number of profitable trades in practice.
Before using it on a live account, test the strategy on a demo account with a reliable broker. Always apply sound risk management and capital management principles. Good luck with your trading!
Download Trend Breaker

See Also:
- Live Chart for Binary Options
- How to Make Money on Binary Options
- What to Do if Your Broker Won't Pay Out
To leave a comment, you must register or log in to your account.