Chart analysis is a vital part of binary options trading, and most traders prefer candlestick charts for their clarity and widespread use. However, alternative chart types also have their place in analysis and trading — one of the most useful being Heiken Ashi.
The advantage of the Heiken Ashi indicator is that it smooths out price fluctuations using a special formula, making the chart easier to read. This allows traders to identify the trend direction more clearly. The Heiken Ashi indicator can be applied to any instrument and timeframe.
How the Heiken Ashi Indicator Works and How to Set It Up
Many trading platforms include Heiken Ashi as a built-in chart type. For example, when using a live chart on our website, this chart type is available without any additional indicators or terminals:
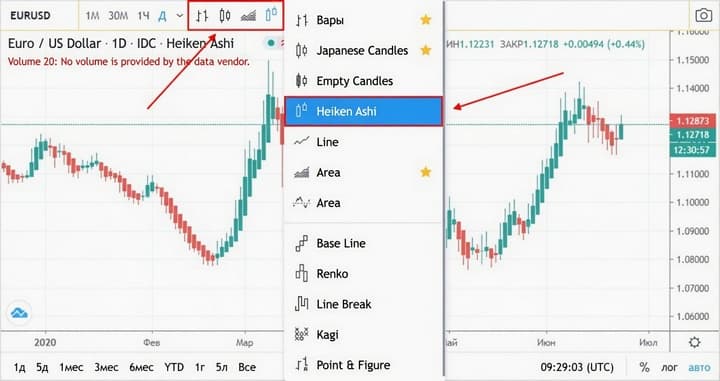
It is also available on other platforms. In MT4, however, Heiken Ashi candles can only be used through a dedicated indicator.
The indicator can be installed using the standard method in the MetaTrader 4 terminal and then applied directly to the chart.
Instructions for installing indicators in MetaTrader 4:
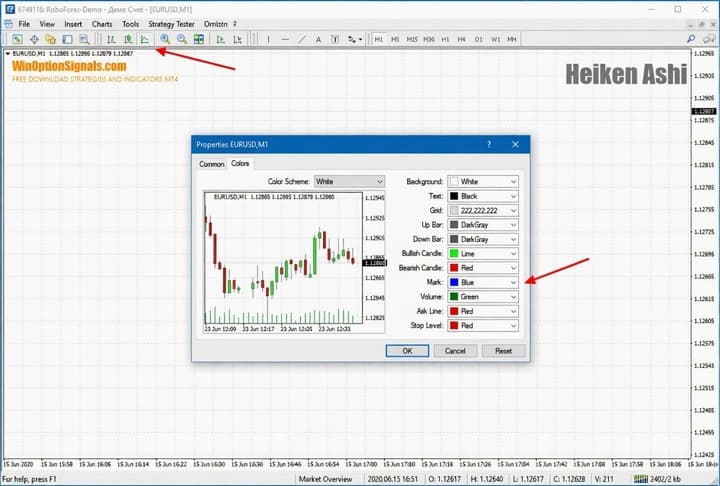
To display the indicator correctly, you will also need to switch the standard terminal chart to a line chart and set the line color to transparent in the chart properties:
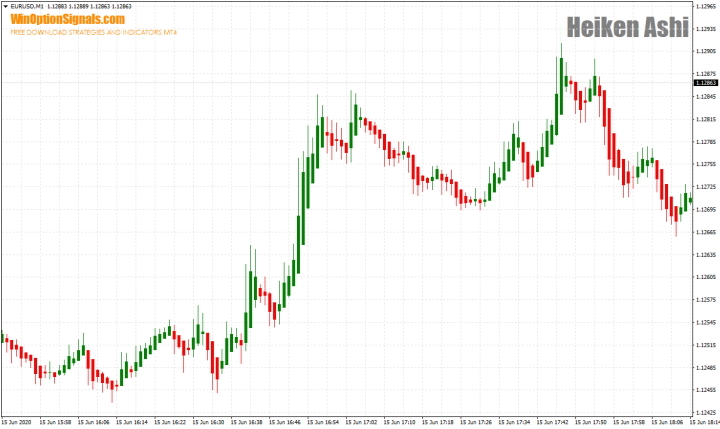
After that, add the Heiken Ashi indicator and adjust the candle colors if you wish. The final result should look like this:
If you prefer to skip the manual setup, you can download the Heiken Ashi indicator along with a ready-made template at the end of this article.
Although standard candles and Heiken Ashi candles look similar in shape, they represent price differently:
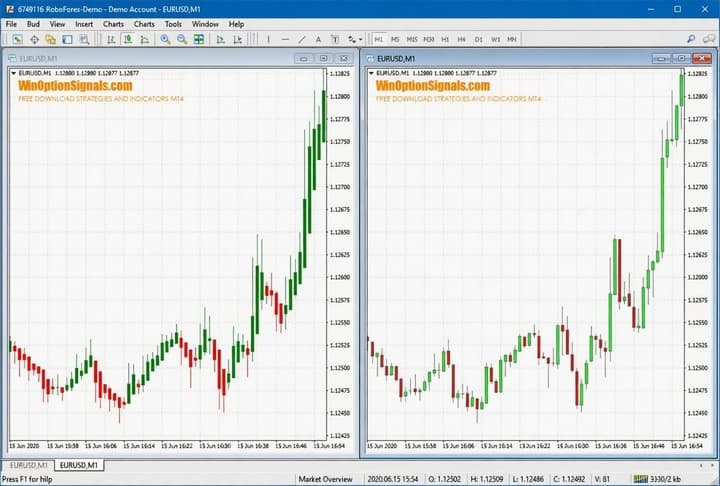
Standard candles display the raw price with no adjustments, while Heiken Ashi candles apply a special formula that modifies the visual representation:
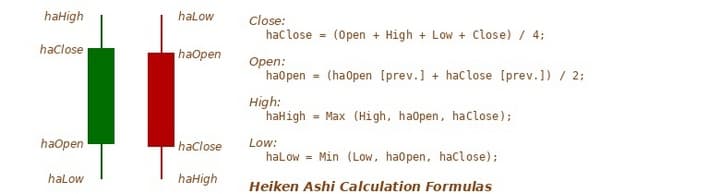
The values used to calculate Heiken Ashi candles are dynamic and derived from the current candle. As a result, the current candle is always calculated with a slight lag, since it depends on the previous one.
This is not purely a drawback, however. This property can actually be used to advantage on volatile currency pairs such as GBP/JPY or EUR/JPY, where Heiken Ashi candles help filter out most false breakouts.
Types of Signals for Binary Options Trading with the Heiken Ashi Indicator
The Heiken Ashi chart can generate several types of signals useful for binary options trading. It can also help identify the trend direction and other market phases.
Identifying the Trend with the Heiken Ashi Chart
Uptrends and downtrends are easy to spot using Heiken Ashi candles. During strong directional moves, a defining feature of these candles is the absence of shadows on one side, depending on the trend direction:
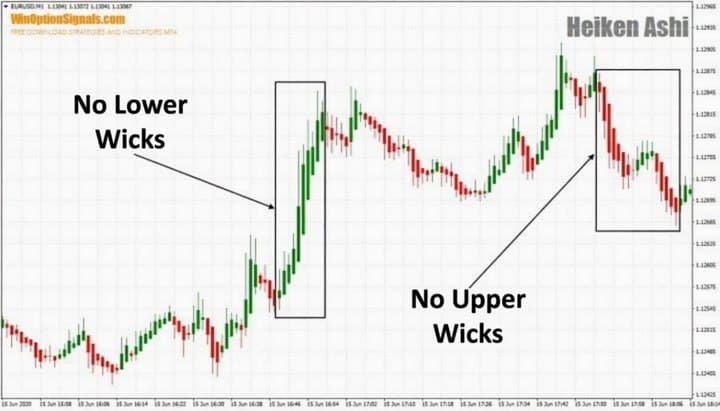
As you can see, during an upward move, green candles have no lower shadows, while during a downward move, most red candles have no upper shadows.
Another clear sign of a trend is when each new candle opens near the midpoint of the previous one — this is particularly visible in the upward move shown in the example above.
When trading, look for three consecutive candles of the same color that follow the rules described above. The end of a trend may be signaled by a change in candle color, a reduction in candle size, or the appearance of a long shadow.
Doji Candles and the Heiken Ashi Indicator
Another useful trading signal is the Doji candle, which is characterized by long shadows and a short body. This candlestick pattern comes from Price Action analysis and works well both on standard candles and with Heiken Ashi:
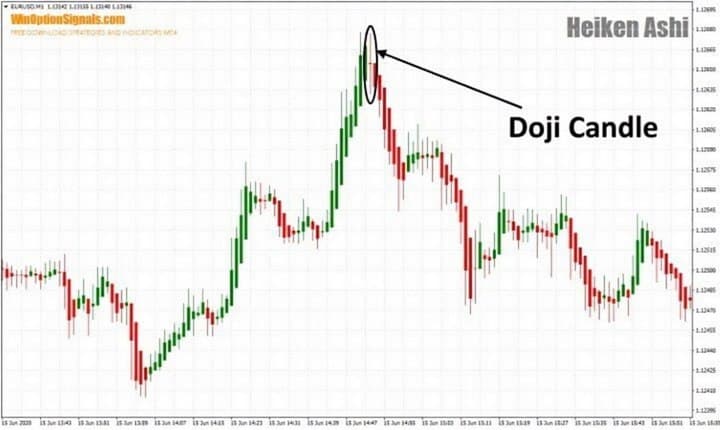
While this is a strong pattern, you should have a clear read on the current trend before acting on this signal.
First and foremost, avoid trading around news releases, even if a Doji candle appears — all upcoming events can be checked in the economic calendar. If, after the news, the trend holds and price moves in the direction indicated by the Doji, you can consider buying the corresponding option. A standard candlestick chart can be used alongside Heiken Ashi as a leading confirmation tool.
Identifying Consolidation with Heiken Ashi
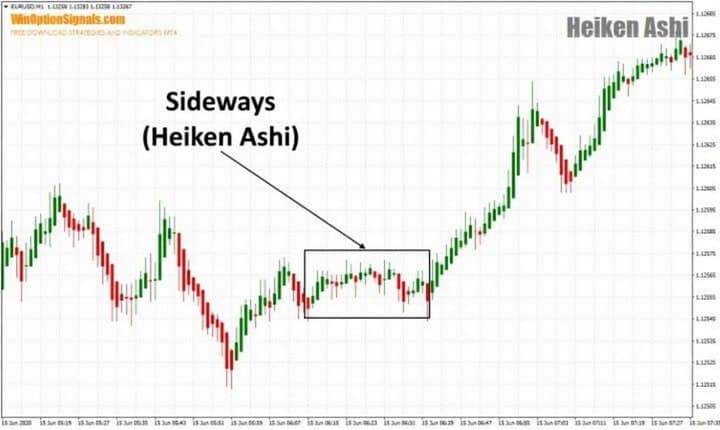
The Heiken Ashi indicator can also be used to identify consolidation (flat) periods — useful for binary options traders as an analytical tool and for Forex traders looking to exit a position.
During a consolidation phase, Heiken Ashi candles become very short, shadows may appear on both sides, and candle color is not significant:
Binary Options Trading Strategies Using Heiken Ashi
The Heiken Ashi indicator works well in combination with other indicators, giving you an edge and helping to identify option entry points more precisely.
Any timeframe can be used, as signal patterns appear consistently across all charts. Expiration should be chosen based on your trading style: 3–5 candles for scalping trades and 5–10 candles for trend-based trades.
Heiken Ashi and Stochastic Oscillator Strategy
For this straightforward strategy, the default settings of the Stochastic Oscillator are sufficient. The idea is to enter trades when the oscillator exits the overbought or oversold zone and Heiken Ashi changes candle color at the same time:
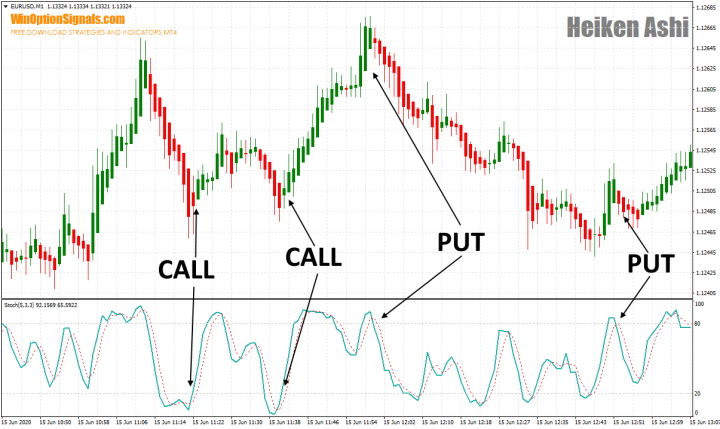
It is worth paying close attention to this particular signal from the oscillator:
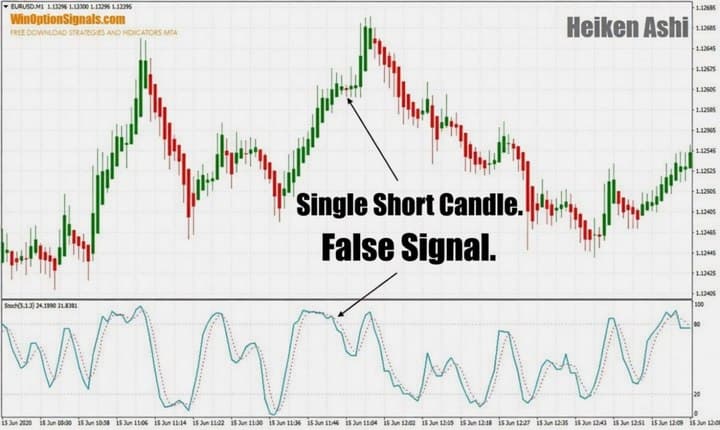
As you can see, although the Stochastic generated a signal, Heiken Ashi candles did not confirm it — making a Put option purchase extremely risky in this case.
Heiken Ashi and MACD Strategy
The Heiken Ashi indicator can also be paired effectively with the MACD indicator:
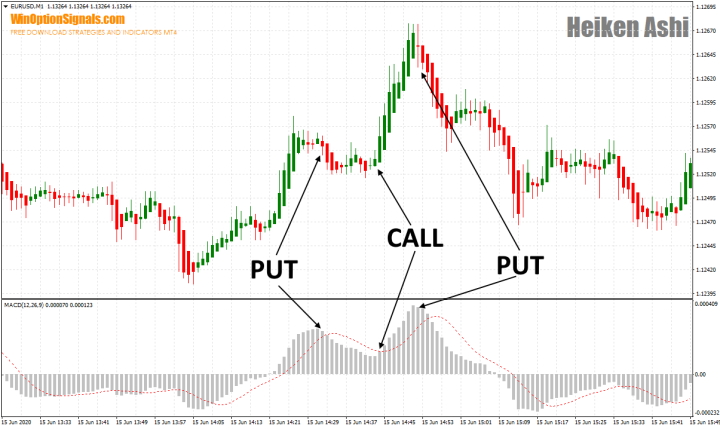
As shown, an option is entered at the moment Heiken Ashi changes color and the MACD histogram bar is higher or lower than the previous one.
For greater signal accuracy, it is also worth waiting for two consecutive Heiken Ashi candles of the same color before entering a trade.
Heiken Ashi and Parabolic SAR Strategy
This strategy is better suited to more experienced traders, as it does not produce clear-cut signals and only makes sense when trading with the trend. The idea is to look for moments when the Parabolic SAR is far from the Heiken Ashi candles and enter an option at that point:
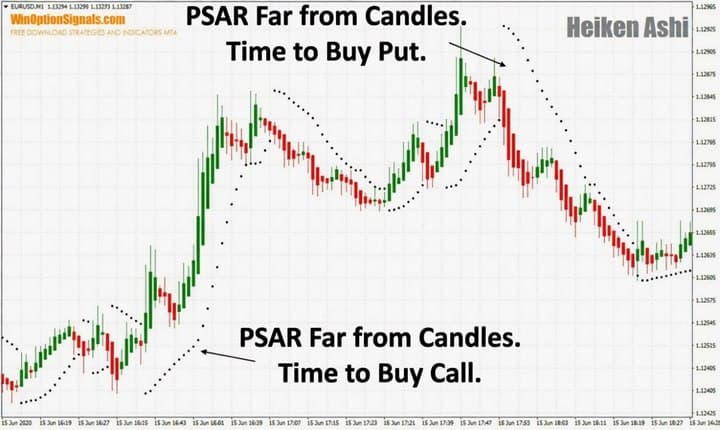
Only enter options with an expiration of at least 10 candles. It is also important to keep in mind that identifying the right moment in real time is considerably more difficult than in hindsight, which is why this strategy is not recommended for beginners.
Tips for Beginners Trading with Heiken Ashi Candles
Heiken Ashi candles can be used by traders at any experience level, but beginners will get the best results by combining this indicator with others to generate more reliable trading signals.
For trend trading, use longer expirations — around 10 candles. Expirations of 1–3 candles are not well suited to Heiken Ashi trading: due to the indicator's artificial nature, such short expirations can lead to losses even when the candle color suggests otherwise.
Avoid using Heiken Ashi on exotic instruments, as high volatility combined with low liquidity can easily catch a less experienced trader off guard. Gold is also best excluded from Heiken Ashi trading strategies.
Conclusion
The Heiken Ashi indicator can be used successfully in binary options trading. Before committing to a live account, however, make sure to test all approaches and Heiken Ashi candle patterns on a demo account first.
Keep in mind that Heiken Ashi candles are artificial constructs, and long shadows that appear on them do not necessarily mean the price has actually reached those levels.
For consistent results, you will also need to trade with a reliable broker — you can find our recommendations in the binary options broker ratings. Happy trading!
Download the Heiken Ashi Template and Indicator
Not sure how a particular strategy or indicator works? Leave a comment below, and subscribe to our YouTube channel WinOptionCrypto — we'll answer your questions in upcoming videos.

To leave a comment, you must register or log in to your account.