Fibonacci retracements are one of the most powerful and time-tested technical analysis tools used by professional binary options traders worldwide. Many beginners have heard of this tool but put it off, considering it too complex for practical use. In reality, mastering a few basic principles of plotting Fibonacci retracements can significantly improve your trading efficiency, help you identify key price reversal zones in advance, and pinpoint high-probability entry points. These are the skills that distinguish a trader who consistently makes money from one who trades by guesswork.

In this article, we explore a trading strategy using Fibonacci retracements on the Binarium platform. You'll learn how to plot these levels correctly, which ones carry the most weight, and how to apply the tool in practice. The Binarium platform provides everything needed to work with Fibonacci levels, and by the end of this article you'll have a ready-made strategy you can put into practice immediately.
Contents:
- Fibonacci Trading on Binarium: Best Times to Apply the Strategy
- How to Use Fibonacci Retracement on Binarium
- Conclusion

Fibonacci Trading on Binarium: Best Times to Apply the Strategy
A Fibonacci-based strategy performs best under specific market conditions, and recognizing them is a key skill. The optimal time to apply it is after a defined trend has formed on the chart with strong upward or downward momentum. This is when Fibonacci levels help identify correction zones from which the price is likely to resume moving in the direction of the main trend. On the Binarium platform, highly volatile assets are best suited for this purpose: the EUR/USD and GBP/USD currency pairs, gold, and popular cryptocurrencies. The best results with these assets come during sessions with the highest market activity — the European and American sessions provide the clearest trading signals based on Fibonacci levels.
The combination of Fibonacci levels with major economic news releases deserves special attention. When an asset's price approaches a significant level — such as 38.2% or 61.8% — just before a key data release, it creates a particularly strong support or resistance zone from which a price rejection is highly probable. After the release confirms the direction of movement, the trader has a reliable signal to open a trade on Binarium. Avoid using this strategy during periods of low volatility and overnight, when trading volumes are minimal and price movements tend to be erratic and unpredictable.
How to Use Fibonacci Retracements on Binarium
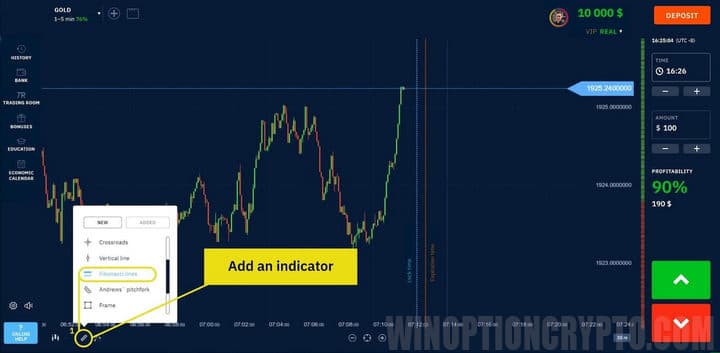
To apply this strategy effectively, you need to learn how to identify key levels correctly. Start by determining the current trend direction, which will serve as the basis for plotting the retracement. Then activate the Fibonacci retracement tool in the Binarium terminal.
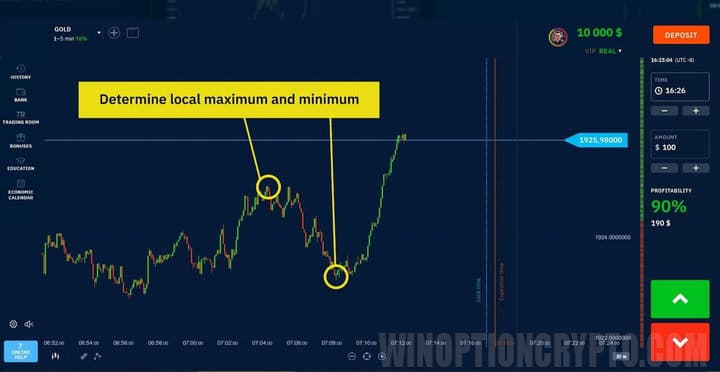
After selecting the tool, mark the highest and lowest price points reached during the selected time period on the chart.
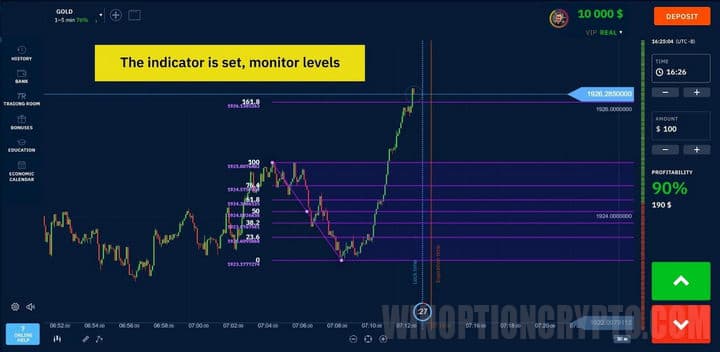
Once the trend direction is established, six levels will appear on the chart. The baseline is set at 0% and the peak at 100%. The intermediate lines are drawn at 23.6%, 38.2%, 50%, and 61.8% — values derived from the Fibonacci sequence.
If needed, additional lines can be added or unwanted ones removed in the indicator settings, though this is not necessary at the outset. Beginners are recommended to use the default settings when plotting Fibonacci retracements on Binarium.
According to experienced traders, price corrections most commonly retrace to the 38.2%–61.8% range.
Please note: avoid entering trades immediately when price reaches these levels, as the correction may still be in progress. Fibonacci retracements can generate false signals, which should be filtered using additional indicators.
Following this system, options with an expiration time of three candles are recommended. The maximum position size should not exceed 2% of the account balance.
Conclusion
Fibonacci retracements are one of those tools that, when used correctly, meaningfully improve the quality of trading decisions. Rather than entering binary options trades at random or relying on intuition, you act according to a clear algorithm grounded in mathematically defined support and resistance levels. The strategy covered in this article is time-tested and used by professional binary options traders worldwide. Its primary advantage is versatility: it works across different assets and timeframes, making it a valuable addition to any trader's toolkit on the Binarium platform.
Don't put off practicing. Open a demo account on Binarium now, select an asset with a clear trend, and try plotting Fibonacci retracements yourself using this article as a guide. After a few days of practice, you'll find yourself reading the market more clearly and identifying entry points with greater confidence. Move to live trading when you feel ready, and let Fibonacci retracements become a reliable tool on your path to consistent trading results.
Having trouble understanding how this strategy or indicator works? Let us know in the comments below, and subscribe to our WinOptionCrypto YouTube channel — we answer all questions in our videos.
To leave a comment, you must register or log in to your account.