Every trader — even a relatively inexperienced one — knows the value of following a trend. "The trend is your friend" has become not just an axiom but a practical guide for generations of market participants. The Guppy binary options strategy is built on exactly this principle: follow the price.
As soon as the system identifies the first signs of an upward or downward move, the trader enters with a Call or Put option depending on the signal received.
Guppy is simple, effective, and generates clear, unambiguous signals — no guesswork or personal interpretation required. Crucially, signals do not repaint over time, which beginners will appreciate. The developers sell this strategy for $87; you can download it here free of charge for evaluation purposes. Let's find out whether it's worth the price.
Contents:
- Key Features
- Installation
- Indicators: Overview and Settings
- Trading Rules
- Call Option Example
- Put Option Example
- Conclusion
- Download Guppy
Key Features of the Guppy Strategy
- Platform: MetaTrader 4;
- Instruments: currency pairs, oil, metals, indices, cryptocurrencies;
- Timeframe: M15;
- Option types: Call / Put;
- Indicators: RainbowMMA_01.ex4, RainbowMMA_02.ex4, RainbowMMA_03.ex4, RainbowMMA_04.ex4, RainbowMMA_05.ex4, RainbowMMA_06.ex4, RainbowMMA_07.ex4, RainbowMMA_08.ex4, RainbowMMA_09.ex4, RainbowMMA_10.ex4, RainbowMMA_11.ex4;
- Expiration: 4 candles;
- Trading hours: 08:00–21:00 UTC;
- Recommended brokers: PocketOption, Quotex.
Installation
Indicators for the Guppy system are installed in the standard way in MetaTrader 4. Open MT4, go to "File" → "Open Data Folder", navigate to the "MQL4" folder and then "Indicators", and copy the indicator files there. Templates are installed in the same way but go into the "Templates" folder. For a step-by-step walkthrough, see the video below:
Guppy Indicators: Overview and Settings
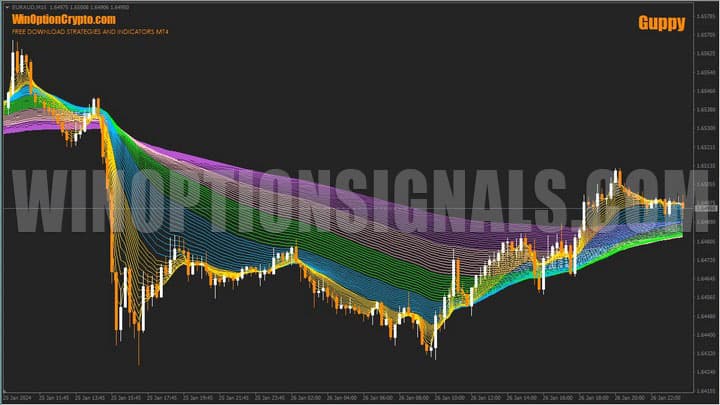
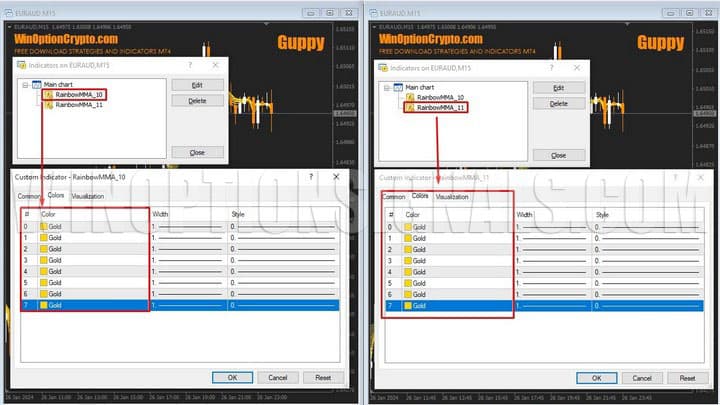
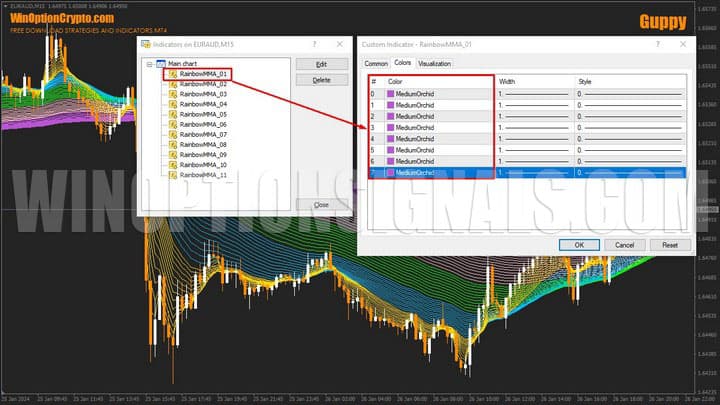
The Guppy strategy uses 11 RainbowMMA indicators, each representing 8 moving averages of different periods. The indicators are organised into pairs and assigned a shared colour. For example, RainbowMMA_10 and RainbowMMA_11 form the gold exponential moving average group.
The system uses five groups of moving averages that reflect trend direction across different timeframes, from short-term to long-term. Together, they give the trader a clear visual read of how any given currency pair or asset is moving across multiple time horizons.
The indicator parameters have been locked by the developer, which is somewhat unusual given that these are standard exponential moving averages calculated over different periods — there is nothing proprietary about the underlying mathematics. The only setting available to the user is colour. The most likely reason for locking the parameters is to prevent changes that would break the relationship between the moving averages and alter the system's logic.
This system is a structured implementation of the Guppy Multiple Moving Average (GMMA) method developed by Australian trader and author Daryl Guppy. Its purpose is to help traders understand market trends more clearly. By analysing how the moving average groups interact, the trader gains a better sense of the direction and strength of the current trend.
The key advantage of multiple moving averages over a single one is their ability to identify trend changes more reliably and filter out price noise, making the underlying direction of an asset's movement easier to read.
Guppy is a versatile strategy applicable not only to binary options but also to stocks, metals, cryptocurrency, and the forex market.
The indicators address three core questions:
- How strong is the current trend?
- How to identify the end of a trend and a reversal?
- How to identify a flat market?
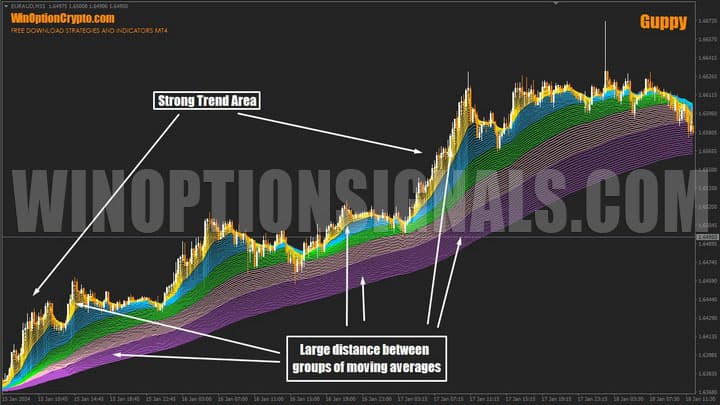
How to Assess Trend Strength
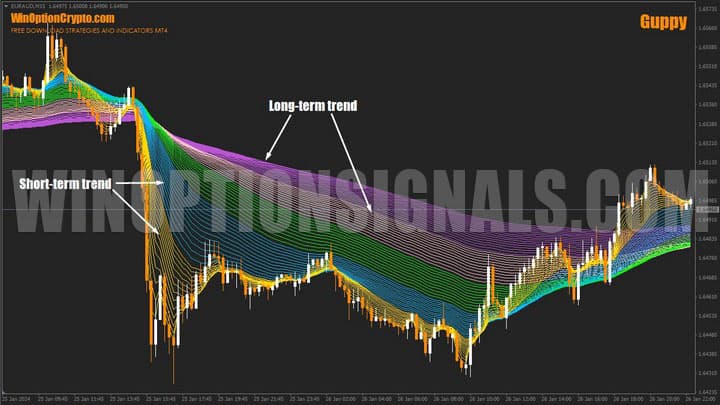
Trend strength is assessed by measuring the distance between the long-term moving average groups (purple and grey) and the short-term ones (yellow and blue).
During a strong directional move, the fast short-term averages will be significantly separated from the slow long-term ones. The wider the gap between the groups, the stronger the trend.
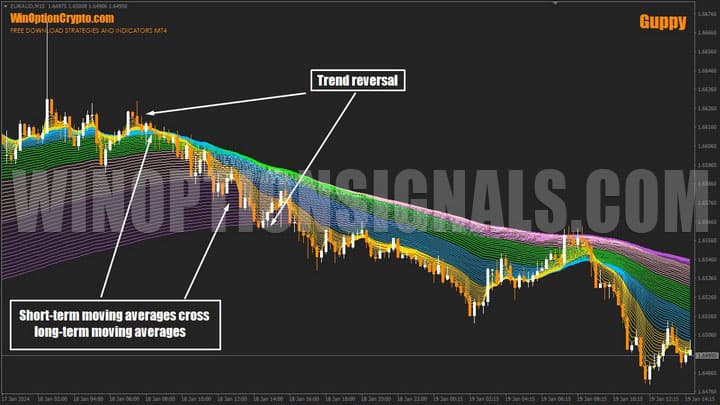
How to Identify a Trend Reversal
A trend reversal is signalled by the short-term and long-term moving average groups crossing each other. A reversal from uptrend to downtrend occurs when the short-term averages cross the long-term averages from above. The mirror signal — downtrend reversing to uptrend — occurs when the short-term averages cross the long-term averages from below.
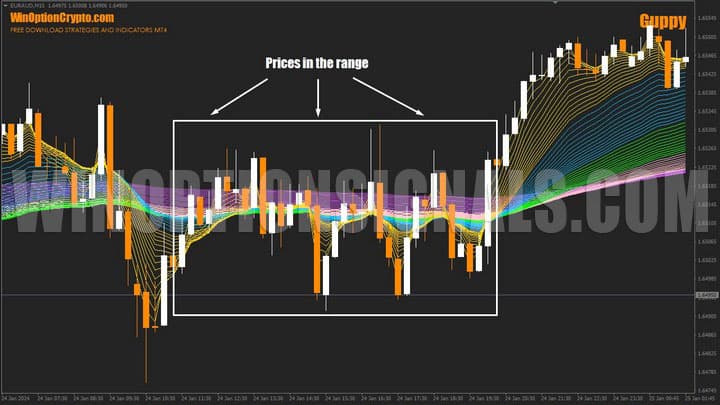
How to Identify a Flat Market
A sideways market is a challenge for most trend-following systems, and Guppy is no exception. Since this is a price-following strategy, filtering out flat conditions is a priority.
Identifying a flat with this system is straightforward: when the short-term and long-term groups of moving averages intertwine and run horizontally with little separation, the market is ranging. As soon as this condition appears, stop trading and look for another instrument where the groups are clearly separated and moving in a defined direction.
Trading Rules
Guppy is a trend-following system. To maximise the proportion of winning trades, monitor for signs of trend strength as described above. The best entries occur when the yellow average group has visually separated from the purple lines by a meaningful distance.
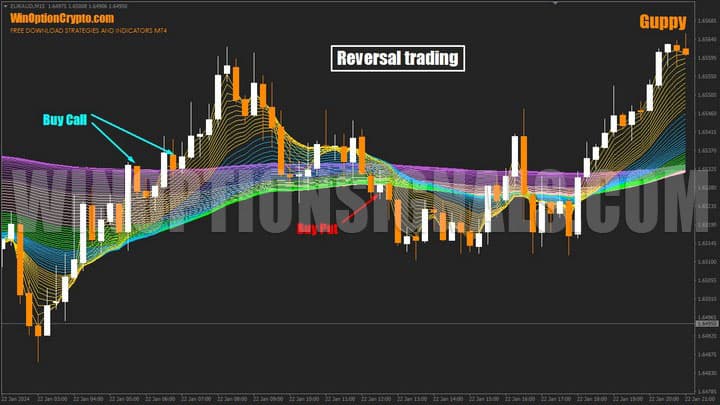
The signal to open a position is a candle closing outside the coloured averages. The strategy offers two signal types: trend reversal and trend continuation. You can use either or both, depending on your backtesting results.
Trend Continuation Trades
To trade in the direction of the existing trend, wait for a candle to close above or below the yellow group (identifying a pullback), then enter when price resumes the main direction and the last candle closes beyond all indicator lines — below for Put, above for Call.
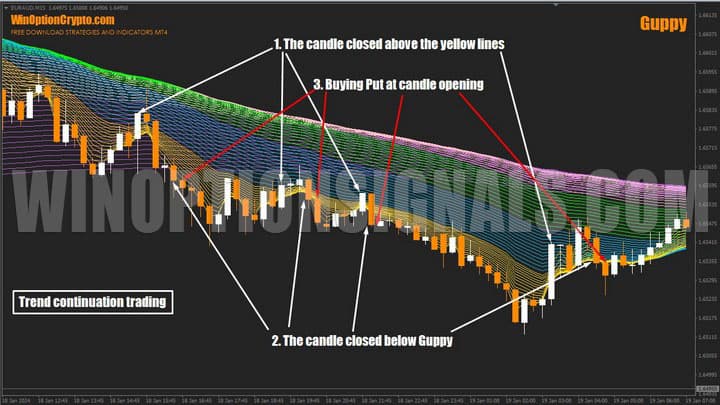
The chart above shows a bearish market example. For a bullish market, the logic is mirrored.
Trend Reversal Trades
To trade a reversal, wait for a confirmed change in trend direction.
To buy Call:
- The yellow moving average group crosses all others from below.
- The candle closes above all coloured lines.
- Buy a Call option at the open of the next candle.
Recommended expiration: 4 candles on the M15 timeframe.
To buy Put:
- The yellow moving average group crosses all others from above.
- The candle closes below all coloured lines.
- Buy a Put option at the open of the next candle.
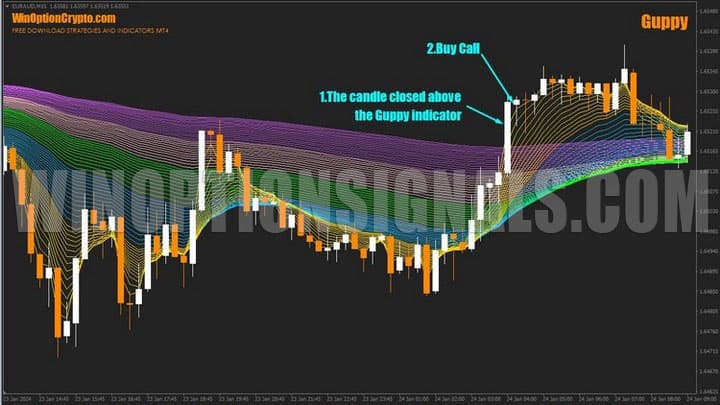
Call Option Example
The chart shows a trend reversal: the yellow moving average group has crossed the purple averages from below. To enter a Call using the reversal method, wait for the candle to close above all coloured indicator lines, then open a Call at the start of the next candle.
Put Option Example
Here the uptrend has reversed to a downtrend, confirmed by the yellow averages crossing all other coloured lines from above. To enter a Put using the reversal method, wait for the candle to close below all coloured lines, then open a Put at the start of the next candle.
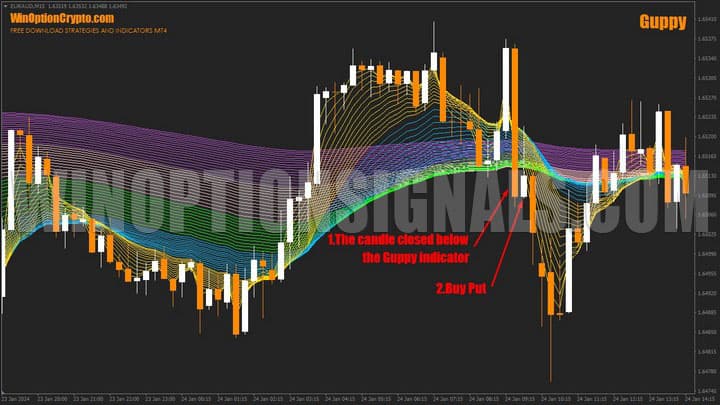
Recommended expiration: 4 candles.
Conclusion
The Guppy binary options strategy is versatile and well-suited to beginners — it produces clear signals at trend reversals without requiring interpretation. The underlying principle is straightforward: when price deviates from its average values by a significant margin, there is a high probability of the move continuing. After a candle closes beyond the indicator lines, the movement is likely to follow. As the examples above show, this approach is effective in practice.
The strategy also works in the forex market. Entry points are the same as for binary options; the difference is that forex traders will need to set a stop-loss and take-profit on each position. Regardless of the market, always test any new strategy on a demo account first, applying consistent risk management and money management principles before risking real capital.
Download the Guppy Strategy

To leave a comment, you must register or log in to your account.