Have you ever wondered what separates a professional trader from a novice? It is not the size of their account or the number of monitors on their desk. Most binary options traders make the same fundamental mistake: they try to predict the direction of the dollar's movement using indicators or chart patterns, while overlooking the fact that the reserve currency is simply a reflection of much larger macroeconomic forces.
The dollar's true driver is the debt market, and its key indicator is the yield on 10-year US Treasury bonds (US10Y). In this article, we examine how movements in government bond yields influence the sentiment of large investors — and why understanding this relationship gives binary options traders an edge, enabling them to anticipate trend reversals in currency pairs before they appear on the chart in their trading terminal.
Contents:
- Why do technical indicators often lie?
- What are bonds and how are they related to the dollar?
- The Golden Rule of Correlation
- How to use US10Y in binary options
- Conclusion
Why Do Technical Indicators Often Lie?
Many beginners in binary options trading turn the chart of the asset they are analyzing into a "Christmas tree," loading it with dozens of indicators — from popular ones like RSI and MACD to obscure "arrow" tools that, in practice, are largely useless due to signal repainting and can only point to impressive-looking historical "results."
The problem, however, is not just the sheer number of indicators. Most of them are price-derived and cannot independently forecast future price movements. All they do is calculate values based on built-in mathematical formulas, which means their signals are inherently lagging.
This often leads to a situation where price continues rising long after an indicator shows "overbought," because major market participants keep pouring money in and pushing prices higher. Relying solely on indicators is therefore not advisable. They capture the effect of price movements, not the cause.
In the case of the US dollar, the bond market is the primary driver of its exchange rate against other currencies. While your preferred technical indicator is "drawing" a trading signal, US bond yields may already be shifting direction — signalling to professional traders that a trend reversal in the currency pair is imminent.
What Are Bonds and How Are They Related to the Dollar?
 To understand how the dollar works, you need to stop viewing it as an abstract symbol on your broker's platform. It is a fully-fledged investment instrument, just like equities. US Treasuries are debt obligations of the American government. When an investor buys them, they are essentially lending money to the US economy at a fixed interest rate — known as the yield.
When ten-year bond yields rise, these instruments become highly attractive to major players worldwide. Since Treasuries can only be purchased in US dollars, investors begin buying the currency in large volumes. This surge in demand drives up the dollar's exchange rate against other global currencies.
As a result, rising bond yields pull capital from around the world into the dollar. As long as US10Y yields continue to climb, the US currency receives strong fundamental support. For a binary options trader, this means that trading against this move — relying on technical analysis alone — carries significant risk.
The Golden Rule of Correlation
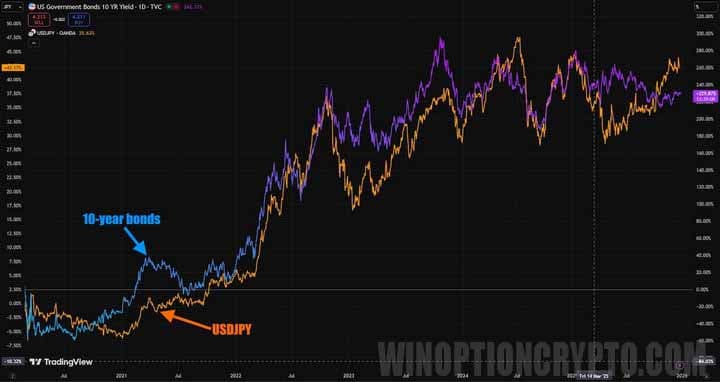
Nothing happens by chance in financial markets. Understanding intermarket relationships allows traders to see the broader picture of capital flows. The strongest correlation is found between 10-year US Treasury yields and the USD/JPY currency pair.
Since the Bank of Japan has traditionally maintained a low interest rate policy, monetary tightening in the US creates a significant yield gap between the two countries. Investors worldwide respond by selling yen and buying dollars to invest in US bonds. For this reason, the US10Y and USD/JPY charts frequently move almost in sync — a relationship known as a direct (positive) correlation.
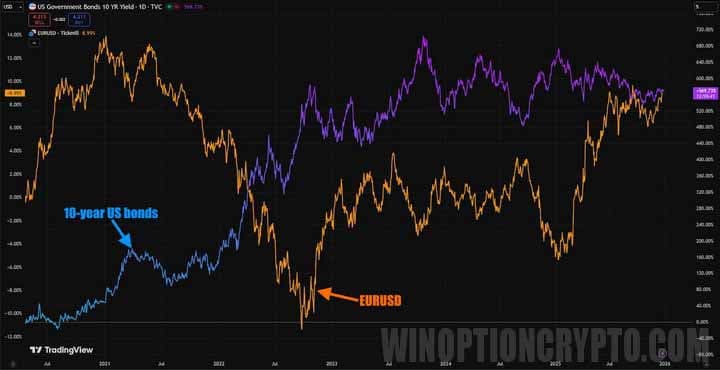
There are also strong examples of inverse correlation — notably between US10Y, the EUR/USD currency pair, and gold. Because holding the precious metal generates no dividends or interest, it becomes a far less attractive store of value when yields rise. Investors sell gold and move funds into bonds, pushing the metal's price lower.
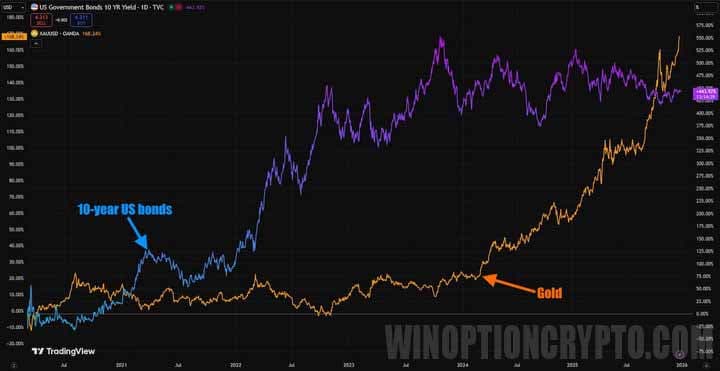
The euro reacts in a similar way: a stronger US dollar, supported by rising bond yields, puts sustained pressure on the single European currency and drives its price down.
For a binary options trader, this relationship acts as a filter for trade decisions. If a Call signal appears on the EUR/USD chart but 10-year US Treasury yields are continuing to break daily highs, that signal is likely false. This brings us to the golden rule: never trade against the direction of bond yields when your currency pair includes the US dollar.
How to Use US10Y in Binary Options
During the trading day, the correlation between these instruments is strongest during the New York trading session — you can read more about this in the article "The Best Time to Trade Binary Options." A trade taken in the direction of bond yields between 6:00–7:00 New York time (13:00–14:00 UTC) has a higher probability of success than at any other time of day. This is the core insight behind day trading currency pairs that include the US dollar.
This window typically closes when the US stock market opens at 9:00–9:30 New York time (16:00–16:30 UTC), as investor attention shifts toward equities.
Conclusion
The number one insight for trading binary options on US dollar currency pairs is to monitor yield levels and their percentage changes throughout the day. If 10-year US Treasury yields are rising ahead of the US session open, look for opportunities to buy dollar Call options against other currencies. If yields are falling, consider dollar Put options in the opening hours of the New York trading session.

To leave a comment, you must register or log in to your account.