The support and resistance indicator for binary options marks the price levels at which the price is most likely to pause or reverse. This makes it possible not only to anticipate reversals in any market, but also to build your own binary options trading strategy or apply an existing trading strategy based on support and resistance levels.
The indicator can also be added to an existing trading system or used as a filter alongside any other indicator.
Key Features of the Support and Resistance Indicator
- Terminal: MetaTrader 4.
- Time frame: Any.
- Expiration: 5 candles.
- Types of options: Call/Put.
- Indicators: Support and Resistance Levels Indicator.
- Trading instruments: All currency pairs.
- Trading hours: 08:00–21:00 UTC.
- Recommended brokers: Quotex, PocketOption, Binarium.
Installing the Support and Resistance Indicator in MT4
The indicator is installed using the standard process in the MetaTrader 4 terminal.
MetaTrader 4 instructions for installing indicators:
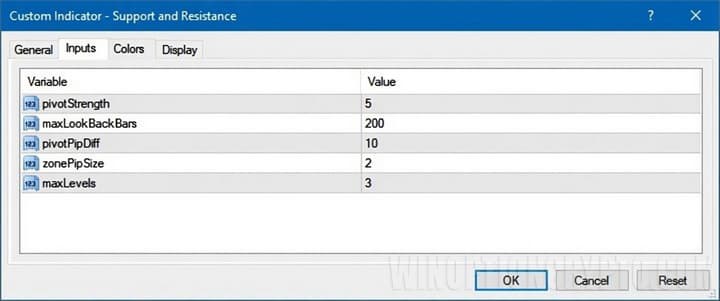
The support and resistance levels indicator offers various settings that can be adjusted as needed. For example, you can increase the number of displayed levels using the "maxLevels" parameter, and adjust the strength of those levels by changing the "pivotStrength" value:
If the indicator is installed manually, you should also change the line color from black to transparent on the "Colors" tab:
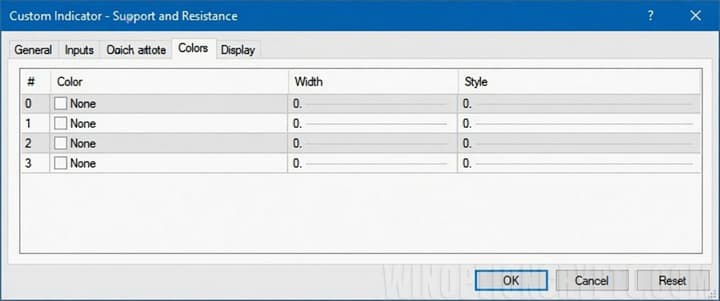
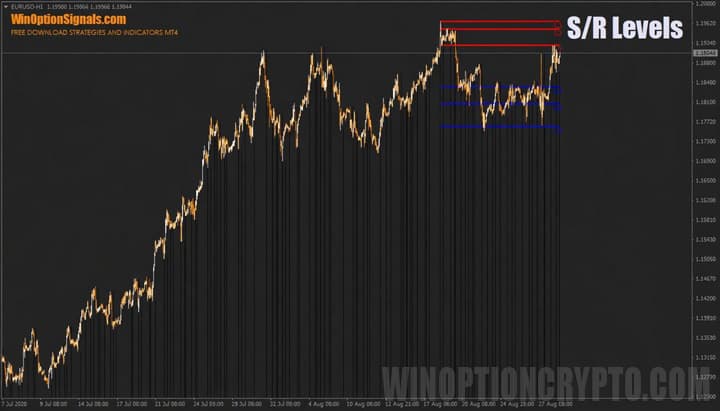
If you skip this step, vertical lines will appear beneath the candles:
Trading Rules and Description of the Support and Resistance Indicator
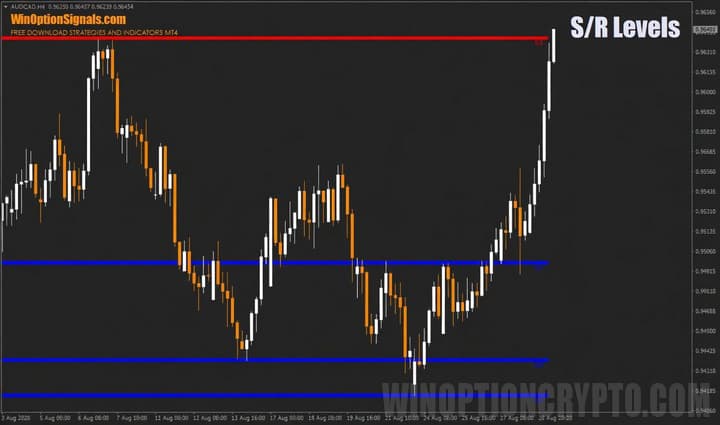
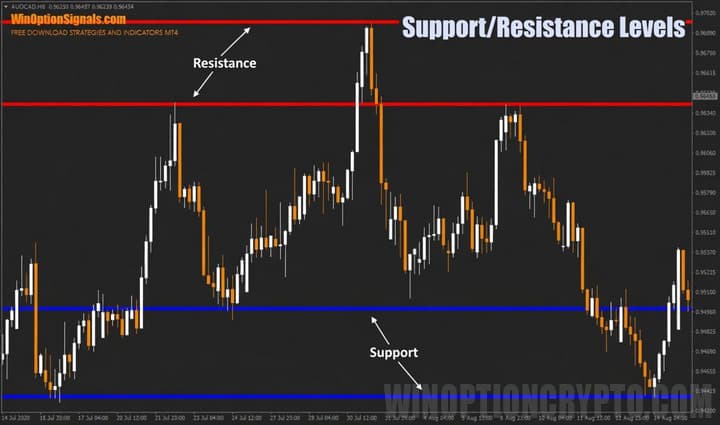
The concepts of "support" and "resistance" provide a clear, logical framework for understanding trends, chart patterns, and price formations. A well-read level helps you anticipate what comes next — whether the price will continue in the same direction or reverse.
"Support" is a price level at which a downtrend is likely to pause and reverse. On the chart, it appears as a horizontal line that the market may briefly cross, after which the price quickly returns above it or consolidates there. Once the price bounces off this line, the trend is expected to reverse and move in the opposite direction.
"Resistance" is a price level at which an uptrend is likely to pause and reverse. This level also appears as a horizontal line that the price typically struggles to break through. Once the price is rejected from this level, a reversal may follow:
A key advantage of using levels in binary options trading is that they apply to any time frame or market, since price behaves the same way everywhere — differences appear only in the magnitude of movement or volatility. Certain levels can also remain relevant for extended periods, allowing traders to re-enter each time the price approaches them. When a level is broken, it will act as a "mirror" level in approximately 90% of cases, switching its role from support to resistance or vice versa — making it useful for further trading.
Working with individual price levels is not the only option — this approach tends to suit beginners. More experienced traders typically work with zones made up of clusters of support and resistance levels. The idea is not to trade breakouts, but to capture price movements within the range as the price approaches a zone. Using the chart from the example above, this looks as follows:
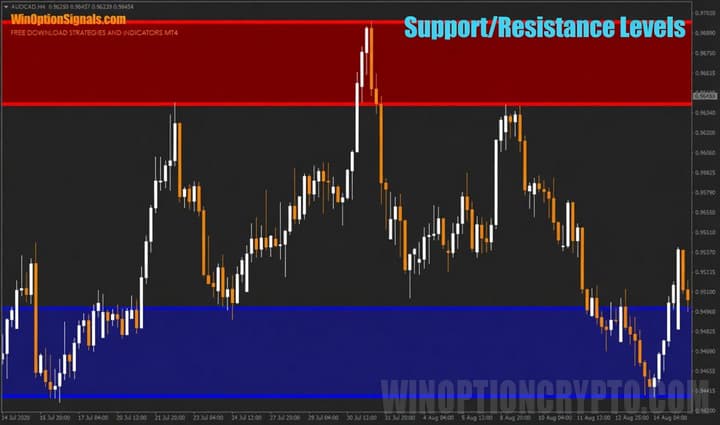
When the price approaches the upper resistance zone (shown in red), Put options should be purchased. When it approaches the lower support zone (shown in blue), Call options should be purchased. It is worth noting that with this approach, trades are not entered at the moment the price touches the zone, but after it has already left it — this confirms that the zone is holding. This method may seem more complex at first, but it is more reliable and accurate, and is worth considering as traders gain experience.
Beyond this indicator, there are a number of other support and resistance indicators for MT4 that work on similar principles but use different calculation methods. These include:
- Supply and demand zones.
- Fibonacci levels.
- Local extreme levels.
- Murray levels.
- Pivot levels.
Any of these can be used in binary options trading, as they differ only in how they are calculated — but in most cases they will highlight the same general price levels.
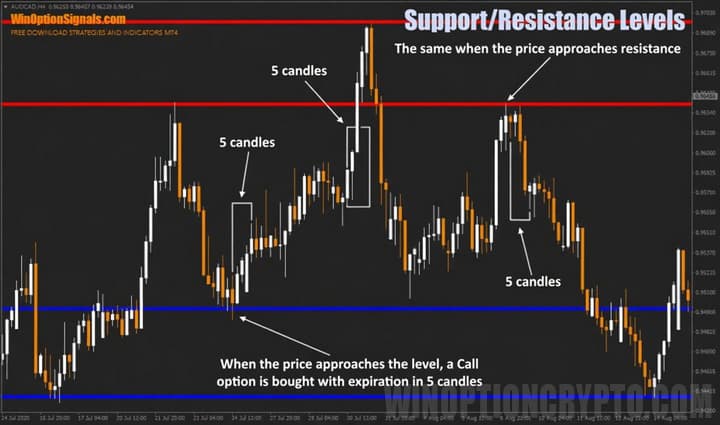
As for the trading rules: a Call option is purchased when the price reaches a support level, and a Put option is purchased when it reaches a resistance level. The expiration time should equal 5 candles on the current time frame.
Signals from the support and resistance indicator can be further improved by learning to correctly identify the trend and trading in its direction. This approach may produce fewer signals overall, since trades are only taken on pullbacks within the prevailing trend.
Examples of Trades Using the Support and Resistance Indicator
To illustrate when options should be purchased using this indicator, let's look at examples on the AUD/CAD currency pair chart with the H4 time frame.
Call and Put Options
Within this range, options could be purchased at several different levels, as a large time frame and a wide range were used:
Conclusion
The binary options support and resistance indicator is straightforward to understand and use, making it suitable for both new and experienced traders. Its main advantage is that it can be applied to any time frame and market, making it compatible with virtually any trading style.
Despite the simplicity of the trading rules, it is always important to follow sound money management and risk management principles, as these protect your account during losing trades. It is also essential to test the indicator on a demo account before using it with real funds.
Remember that choosing a reliable broker is an important part of successful trading. You can find our recommendations in the binary options broker rating.
Download the Support and Resistance Indicator
Not sure how this indicator works? Leave a comment below, and subscribe to our YouTube channel WinOptionCrypto — we'll answer your questions in upcoming videos.
See Also:
- How to make money on binary options
- Pros and cons of trading binary options
- How to make a profit by trading on clean charts
- How to adapt a Forex strategy to Binary Options?
To leave a comment, you must register or log in to your account.