There are quite a few indicators that signal an imminent trend reversal and are suitable for binary options trading. Some have already become classics, while others have appeared more recently. Below is a list of the most popular ones.

Why Reversal Indicators Are Popular
A binary options trade remains open for a fixed period of time. For this reason, most traders look to close positions on the assumption that the current trend is about to reverse, even while the price is still moving in its current direction. To profit consistently from binary options trading, you need to identify chart patterns that signal an imminent trend reversal. Specialised indicators have been developed for exactly this purpose.
These tools stand out because they anticipate a reversal in advance and provide fairly accurate signals that do not change over time — that is, they do not repaint. Traders using such indicators receive early warning of an approaching correction before it occurs.
Another advantage of reversal-based technical analysis tools is their ease of use. Understanding the signals typically requires nothing more than knowing what each arrow on the chart indicates.
Instructions for installing indicators in MetaTrader 4:
Relative Strength Index (RSI) — an Accurate Reversal Indicator for Binary Options
The RSI has been used by traders since the late 1970s across a wide range of financial instruments, including binary options and currency pairs. It works by comparing overall price values over a selected time interval.
The resulting readings range between 0 and 100 and are displayed as a curved line in a separate window. The indicator also marks overbought and oversold levels — represented by two horizontal lines at the 30 and 70 marks respectively.
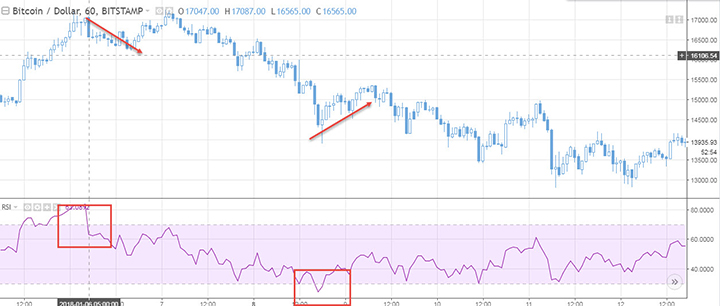
The screenshot above shows the indicator in action on the BTC/USD (Bitcoin to US Dollar) pair. We recommend acting on signals that occur when the price chart moves beyond the overbought or oversold levels — these situations frequently result in a correction or a full trend reversal.
The logic is straightforward: when the RSI line is above 70, the asset is considered overbought. As soon as it drops back below this level (crossing it from top to bottom), a sell order should be considered.
When the RSI line is below 30, the asset is oversold. As soon as it breaks back above that level, a buy order should be considered.
We strongly advise against opening trades while the RSI is sitting above the overbought line or below the oversold line, as this significantly increases the risk of losses.
The RSI indicator also provides other signals applicable to stock trading, but in our view, trading breakouts of the overbought and oversold levels consistently delivers the best results.
Download the RSI Indicator
Momentum
Momentum is an excellent impulse reversal indicator for binary options. It has straightforward settings, and we recommend keeping them at their defaults and working with the indicator on the timeframe available on your platform.
Traders use several formulas to configure this tool. The most common approach is based on the difference between closing prices across the current and previous time periods.
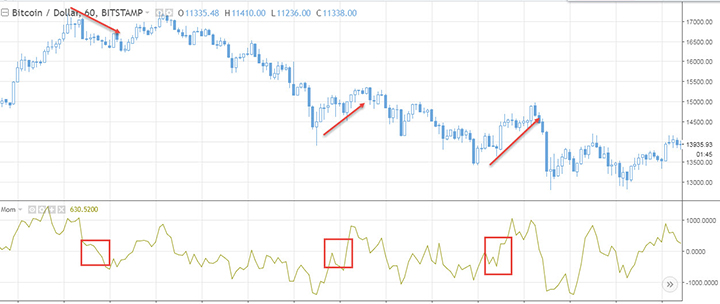
There are two main signal types that traders watch for. The first occurs when the Momentum line reaches a significant level and begins to reverse. This point is somewhat contentious — there is no consensus on which values should be considered significant. Some traders use overbought and oversold levels (configurable in the indicator settings), though this approach is not always effective.
The screenshot above illustrates the second signal type: the indicator line crossing the zero level. In this case, it serves as confirmation of the current trend direction.
Download the Momentum Indicator
Q2MA
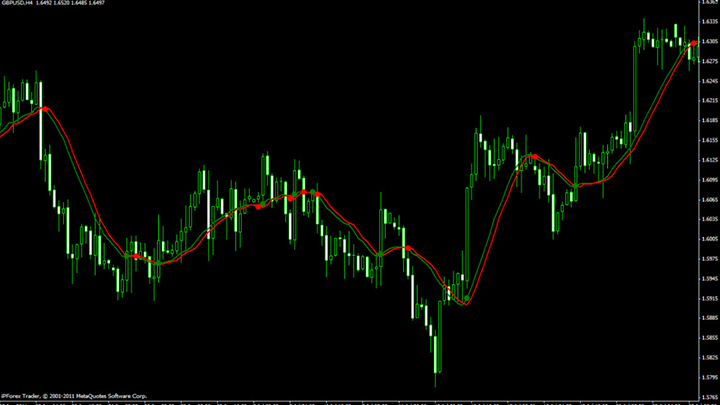
Q2MA is one of the more recent reversal indicator developments. It is based on a moving average algorithm — a calculation method used in many trading strategies. In essence, the indicator consists of two moving averages, and a trade signal is generated when the two lines cross.
The main drawback of Q2MA is that it repaints frequently. While it is simple to use and available on most platforms, the high probability of repainting means we do not recommend it for binary options trading.
Download the Q2MA Indicator
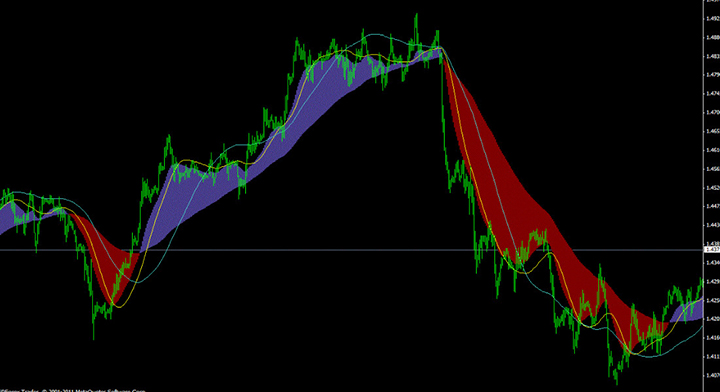
Forex Glaz
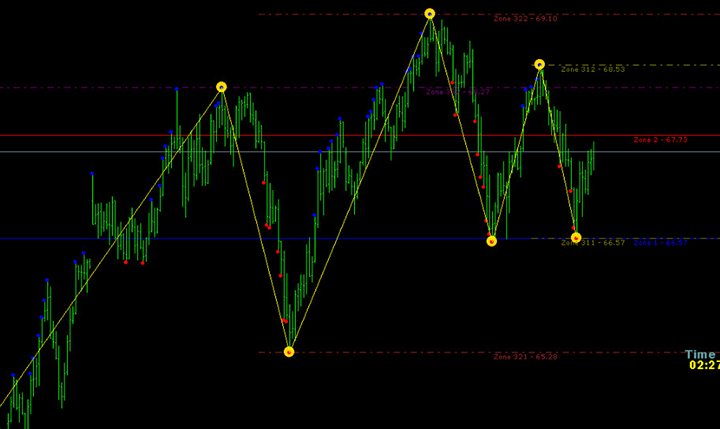
The indicator's logic is simple: dots (extremes, or price peaks) appearing on the chart signal an imminent trend reversal, while lines show the projected direction of the price. This makes Forex Glaz particularly appealing to novice traders.
However, its simplicity comes with a significant caveat. Like Q2MA, Forex Glaz repaints frequently — the yellow dots on the chart can disappear suddenly after a buy or sell order has already been placed. The developers advise against using it on timeframes below 15 minutes, though in practice the indicator performs similarly across other timeframes as well.
Download the Forex Glaz Indicator
Visual MACD
Compared to the traditional MACD, Visual MACD displays its output in a separate window and includes an additional signal line. Trading with Visual MACD follows these rules:
- A buy order can be opened when the two lines cross from bottom to top and the histogram turns blue.
- A sell order can be placed when the signal lines cross from top to bottom and the histogram turns red.
These signals are not always accurate, and the existing trend may continue.
Download the Visual MACD Indicator
Recommended Indicators
For identifying trend reversal points, we recommend the Stochastic, Momentum, and RSI indicators. Any one of these can be used on its own — and if you have to choose just one, RSI is the strongest option for binary options trading.
This comes down to two key factors:
- no repainting;
- signals consistently appear ahead of the event.
Most modern indicators are sold commercially, which creates a particular limitation: the developers keep their calculation formulas proprietary, making it impossible for traders to independently assess when the tool will be useful and when it will not.
On top of that, indicators with closed-source formulas cannot be independently verified, and their effectiveness cannot be properly analysed.
The other main drawback of paid indicators is the cost itself. No technical tool delivers accurate signals all the time, and no single indicator suits every trading strategy. Paying for something that may not deliver results is rarely justified.
Not sure how a particular strategy or indicator works? Leave a comment below, and subscribe to our YouTube channel WinOptionCrypto — we'll answer your questions in upcoming videos.
To leave a comment, you must register or log in to your account.