The TDI binary options indicator is a versatile trend oscillator. Its signals help financial market traders identify the most likely direction of price movement in the near term, enabling them to make informed decisions when trading call or put binary options.
This tool is built on the popular RSI indicator. Using RSI as its foundation, TDI measures trend strength while a dedicated algorithm filters out market noise, and built-in Bollinger Bands help gauge the amplitude of exchange rate fluctuations. The result is a clear, consolidated view of what is happening with the instrument being traded. The versatility of this oscillator makes it well suited for use alongside other technical analysis tools and a wide range of trading strategies.
Contents:
- Key Features
- Installation
- TDI Overview and Settings
- TDI Trading Rules
- Opening a Call Option
- Opening a Put Option
- Conclusion
- Download TDI Indicator
Key Features of the TDI Indicator
- Terminal: MetaTrader 4;
- Timeframe: M15;
- Expiration: 6 candles;
- Option types: Call/Put;
- Indicators: TDI-With_Alerts.ex4;
- Trading instruments: currency pairs, commodities, cryptocurrencies, stocks;
- Trading hours: 08:00–21:00 UTC;
- Recommended brokers: Quotex, Pocket Option, Binarium.
Installing the TDI Binary Options Indicator
Installing this oscillator on MetaTrader 4 follows the standard procedure. Add it to the terminal's root folder by opening the "File" menu in MT4 and selecting "Open Data Folder." In the folder that opens, navigate to "MQL4" → "Indicators" and move the TDI file there. Templates are installed in the same way, but must be placed in the "templates" folder instead. For a full walkthrough, watch our video:
TDI Indicator: Overview and Settings
The Traders' Dynamic Index (TDI) has a long track record of successful use across a wide variety of trading strategies. It first gained attention in the early 2000s. According to Dean Malone, the concept came to him in 2005 while he was working on the CompassFX project. The indicator has been updated several times since then. Today, despite its somewhat complex appearance, it is essentially a compilation of four independent indicators combined in a single window around one unified idea.
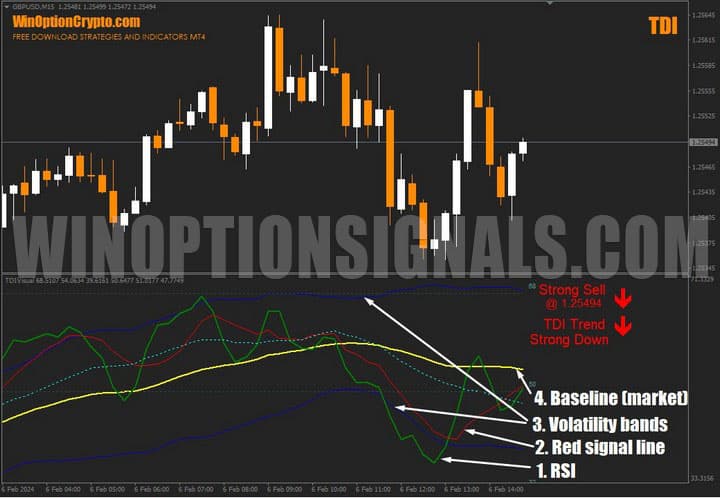
TDI components:
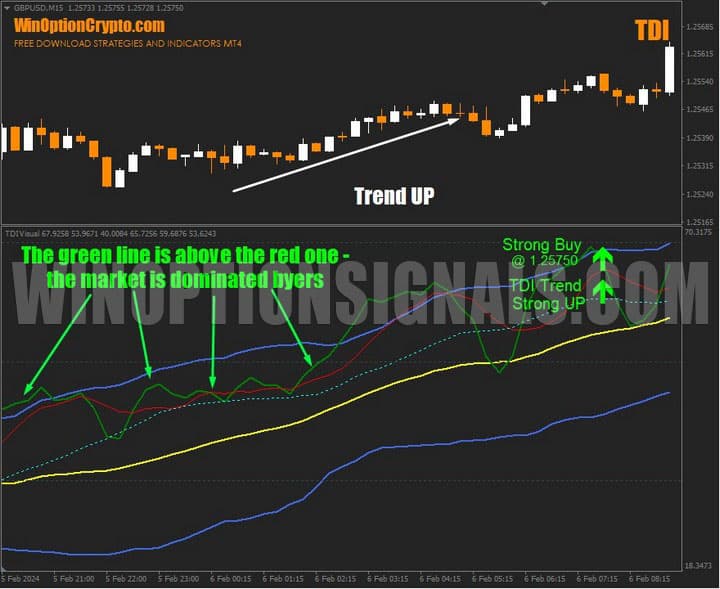
- RSI (green line);
- Signal moving average (red line);
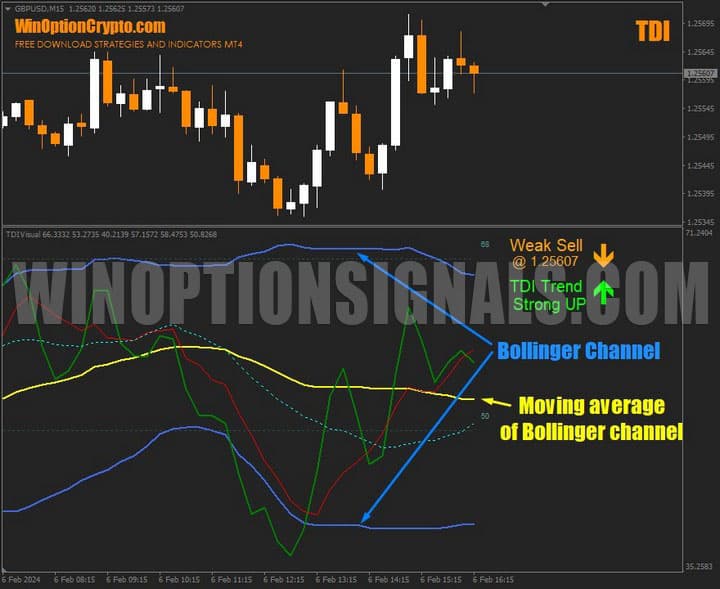
- Bollinger volatility bands (blue bands);
- Base moving average (yellow line).
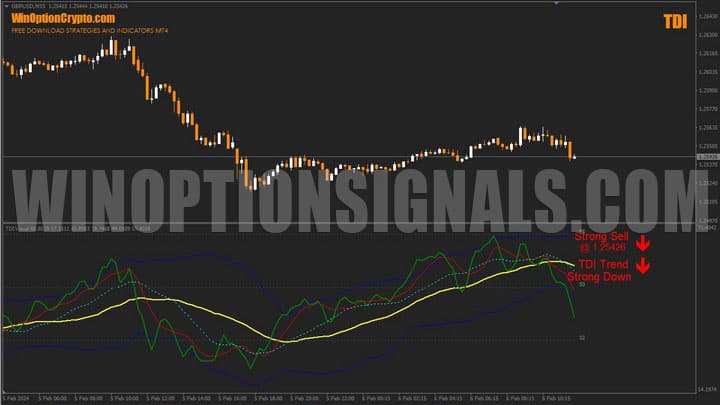
Because the indicator combines several core analytical concepts, it can function as a standalone trading system. It gained widespread popularity among traders for its ability to accurately assess the current state of the market. The indicator is displayed in the panel below the main chart and comes with a set of standard settings.
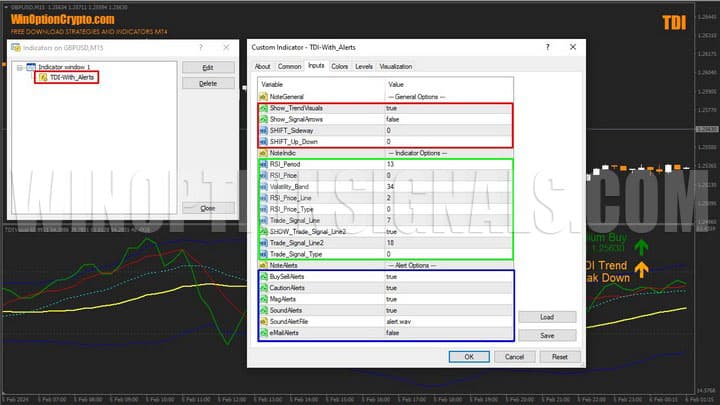
All settings are divided into three blocks: general, indicator settings, and alerts. In the general block, you can adjust the value offset and enable the display of signals on the price chart. In the indicator settings block, you specify the calculation periods for the TDI components — RSI (green line), Bollinger Bands (dark blue bands), and the signal line (red).
It is worth noting that the default settings have been thoroughly tested and backtested. They should only be changed when strictly necessary and when results with the default settings are consistently unsatisfactory.
The green line represents the "fast" RSI calculated over a shorter period, while the red line represents the "slow" RSI calculated over a longer period.
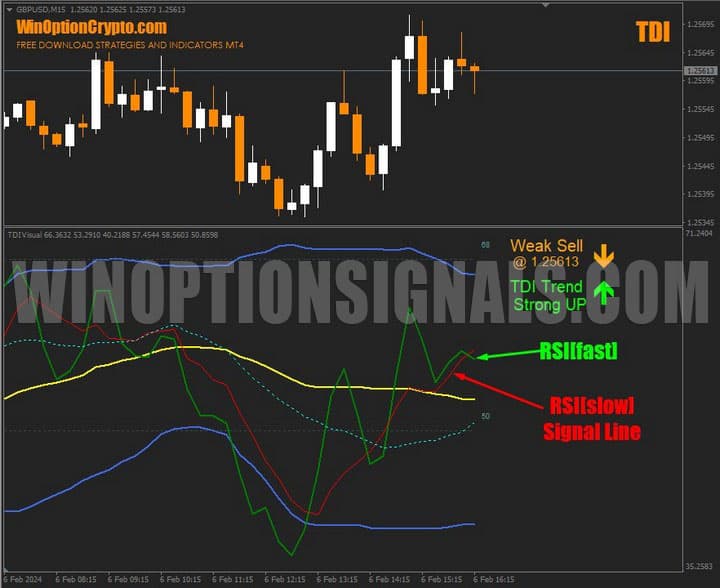
The dark blue Bollinger Bands are plotted based on RSI values, and the yellow line is the moving average between the upper and lower boundaries of the volatility channel.
RSI Price value encoding:
0 = Close price [Default]
1 = Open price;
2 = High price;
3 = Low price;
4 = Median price, (high+low)/2;
5 = Typical price, (high+low+close)/3;
6 = Weighted close price, (high+low+close+close)/4.
RSI Price Line value encoding:
0 = Simple moving average [Default];
1 = Exponential moving average;
2 = Smoothed moving average;
3 = Linear weighted moving average.
- These values can be entered as input parameters for RSI Price and RSI Price Line. Depending on the selected value, the indicator will be calculated using a specific price type and smoothing method. Before changing these settings, we recommend testing the signals against historical data.
Trading Rules for the TDI Indicator
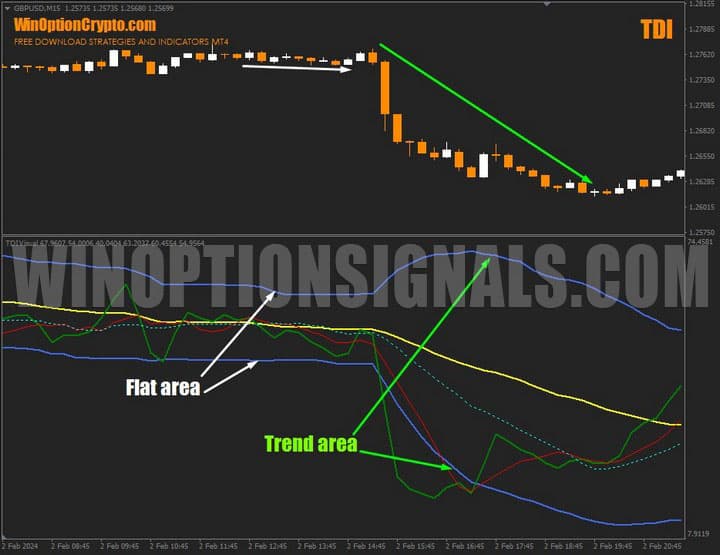
The TDI indicator generates a large number of effective signals for buying binary options. It performs best during periods of sustained directional price movement — as is the case with any trend-following system. For this reason, it is worth selecting assets with high price volatility when using this oscillator.
The primary purpose of this tool is to show the direction and strength of the current trend. With a clear trend identified, determining the right moment to open a binary options trade becomes considerably more straightforward.
Trend Direction
When the green line is above the red line, buyers are dominating the market and an upward price trend is in play.
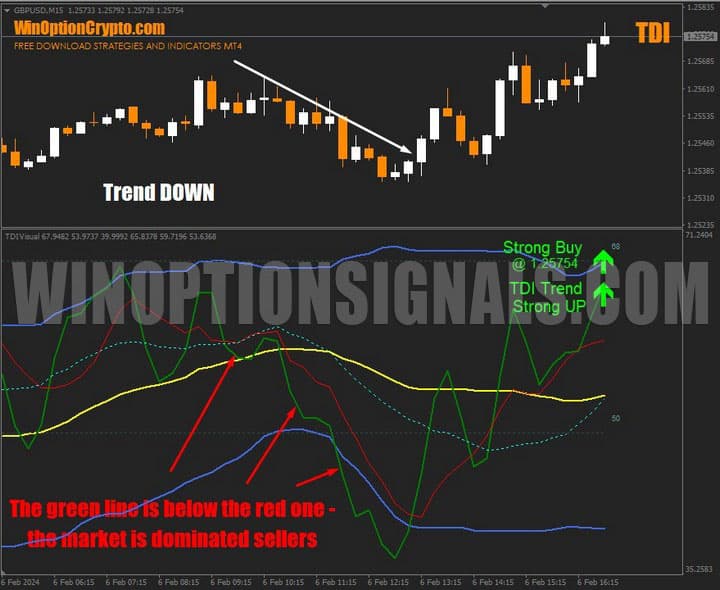
When the situation is reversed and the green line falls below the red line, sellers are in control, signalling a downward trend.
Volatility
The Bollinger Bands reflect market volatility. When they contract, market activity is low and traders should avoid entering positions. When the bands widen and price shows high volatility, it is time to increase trading activity.
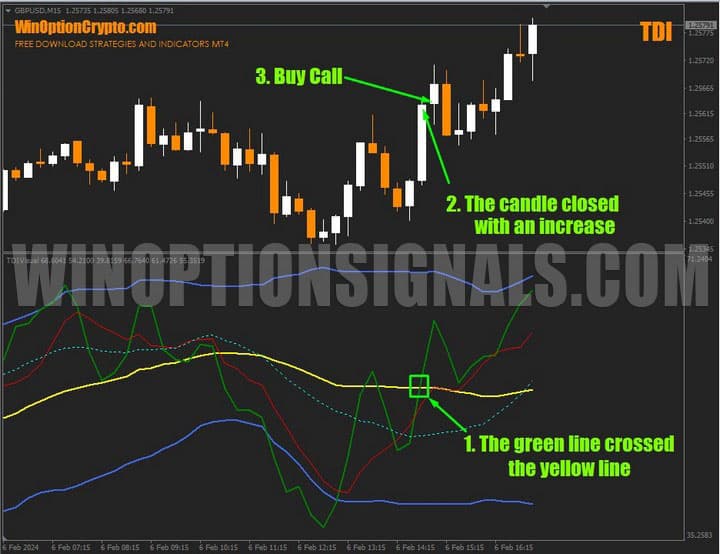
Basic rules for buying a call option:
1. The green TDI line crosses the yellow moving average from below.
2. The candle on which the crossover occurs closes bullish.
3. At the opening of the next candle, buy a call option with an expiration of 6 candles.
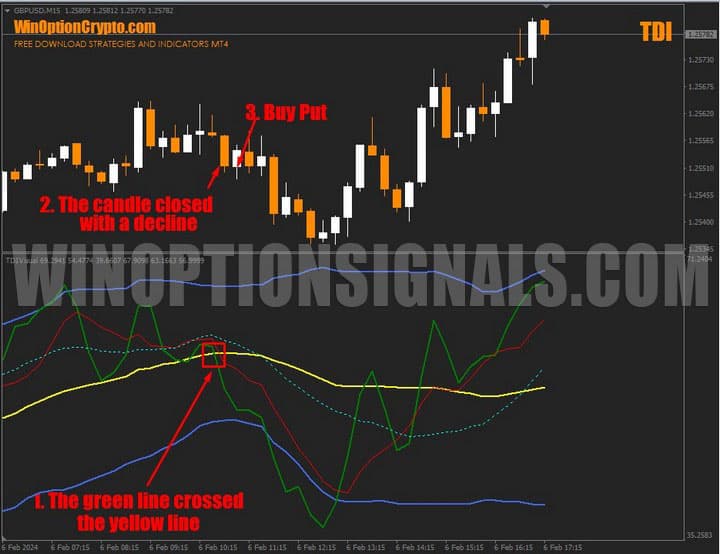
Basic rules for buying a put option:
1. The green TDI line crosses the yellow moving average from above.
2. The candle on which the crossover occurs closes bearish.
3. At the opening of the next candle, buy a put option with an expiration of 6 candles.
Opening a Call Option
The green TDI line crosses the yellow moving average from below. The candle closes bullish. At the opening of the next candle, buy a call option.
Opening a Put Option
The green TDI line crosses the yellow moving average from above. The candle closes bearish. At the opening of the next candle, buy a put option.
Conclusion
The TDI indicator can be used in a variety of trading systems, including binary options scalping. That said, it will appeal not only to traders who prefer quick trades, but also to those who favour a more measured, medium-term approach.
The indicator's author claims it can produce up to 80% profitable trades. We take a more measured view: with the skill and knowledge to identify trends reliably, this oscillator can undoubtedly be a valuable tool. It highlights strong entry points, but should be used alongside appropriate filters — including volatility filters — to improve the ratio of winning trades. When trading binary options with TDI, avoid low-activity currency pairs and ranging markets, and trade only during active market hours.
Before using it in live trading, be sure to test the tool thoroughly on a demo account. Only after verifying its performance in practice should you move to trading with reliable brokers. Always apply sound risk management and money management principles. We wish you favourable trends!
Download the TDI Indicator

To leave a comment, you must register or log in to your account.