The TRIX Crossover indicator for binary options is designed for active intraday trading and scalping. It generates a high volume of entry points that will appeal not only to binary options traders but also to intraday traders in the Forex market.
The authors charge $39.99 for this analytical tool, but you can download it for free from our website for evaluation purposes. In this review, we'll assess whether it's worth the price and how effective it is in live trading.
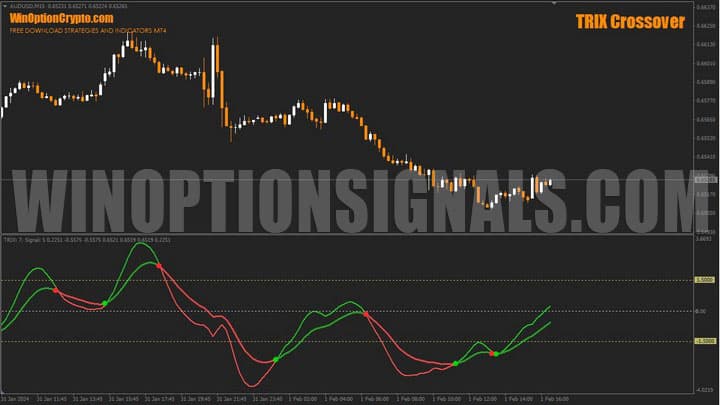
The indicator is based on an exponential moving average with triple smoothing. Its key distinction from classic moving averages is that the curve is displayed in the subwindow below the chart — where oscillators are typically found — rather than on the candlestick chart itself, as the name might initially suggest. But let's take it step by step.
Contents:
- Key Features
- Installation
- TRIX Crossover Overview and Settings
- Trading Rules for TRIX Crossover
- Opening a Call Option
- Opening a Put Option
- Conclusion
- Download TRIX Crossover
Key Features of the TRIX Crossover Indicator
- Terminal: MetaTrader 4;
- Timeframe: M30;
- Expiration: 3 candles;
- Option types: Call/Put;
- Indicators: TRIX.Crossover.ex4;
- Trading instruments: currency pairs, commodities, cryptocurrencies, stocks;
- Trading hours: 08:00–21:00 UTC;
- Recommended brokers: Quotex, Pocket Option, Binarium.
Installing the TRIX Crossover Binary Options Indicator
The TRIX.Crossover indicator is installed using the standard procedure in the MetaTrader 4 platform. To do this, add it to the terminal's root folder by selecting "File" in MT4, then "Open Data Folder." In the folder that opens, navigate to "MQL4," then "Indicators," and move all the necessary files there. Templates are installed in the same way, but are placed in the "Templates" folder instead. For more detailed installation instructions, watch our video:
TRIX Crossover Indicator Overview and Settings
This tool has several important parameter blocks that are worth examining in detail.
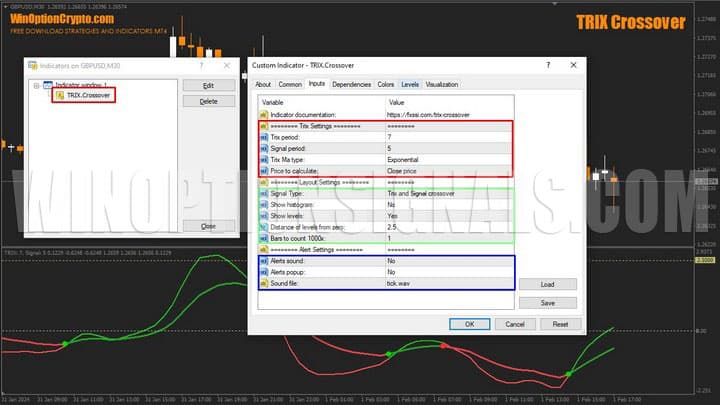
The main settings are located in the "Trix Settings" block, highlighted with a red rectangle in the image above:
- Period — the calculation period for the "slow" line;
- Signal Period — the calculation period for the "fast" signal line;
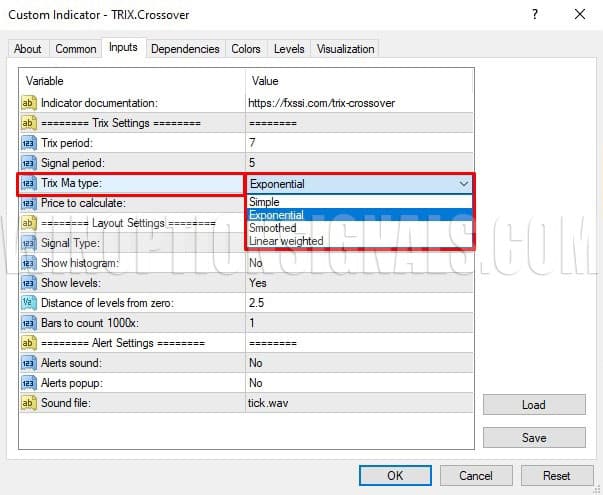
- MA Type — the moving average type;
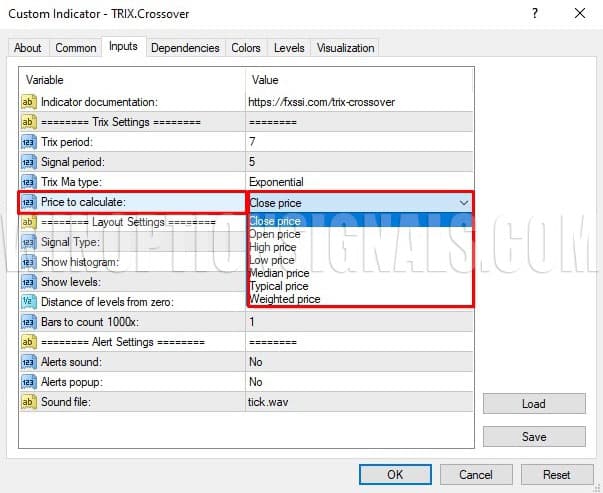
- Price to calculate — the price type used in the calculation.
The moving average types available for this tool are shown below.
In addition to the classic Close price, the indicator can also use other price types in its calculations:
The next settings block covers appearance (green rectangle in the first image of this section). The most important parameter here is the signal type, which can be set to one of three values:
- Crossover of the fast and slow lines;
- Crossover of the zero line;
- Both lines moving in the same direction.
The remaining parameters in this block are:
- Show histogram (on/off) — displays the difference between the fast and slow lines;
- Show levels (on/off) — adds or removes horizontal levels;
- Distance of levels from zero — the distance between the auxiliary levels and the zero line;
- Bars to count 1000x — the history depth used for indicator calculations, as a multiplier of 1,000 bars.
The last settings block covers alerts (blue rectangle in the first image of this section). Here you can select the alert sound, and enable or disable sound signals and pop-up notifications.
TRIX Crossover is a versatile tool for trading financial markets. Thanks to triple smoothing, it filters out minor price fluctuations and generates signals only when a stable trend is present.
The shorter the calculation period, the more sensitive the indicator is to price movements, which results in more signals. Keep this in mind when selecting optimal parameters during testing. The indicator offers three operating modes, each described in detail below.
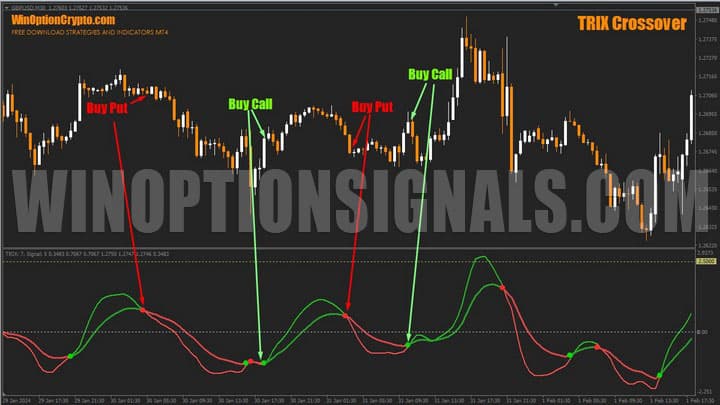
Trix and Signal Crossover Mode
In this mode, the oscillator signals a potential trend reversal by crossing the fast and slow lines. The crossover point is marked with a dot: green indicates an uptrend, red indicates a downtrend.
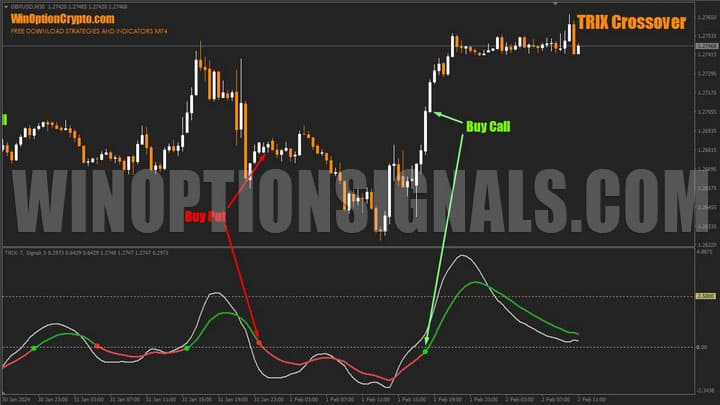
Trix Zero Line Crossover Mode
In this mode, the oscillator generates trend-following signals. A red dot marks a crossover of the zero line from above (sell/Put signal). A green dot marks a crossover from below (buy/Call signal). This mode is suited to medium-term trend trading.
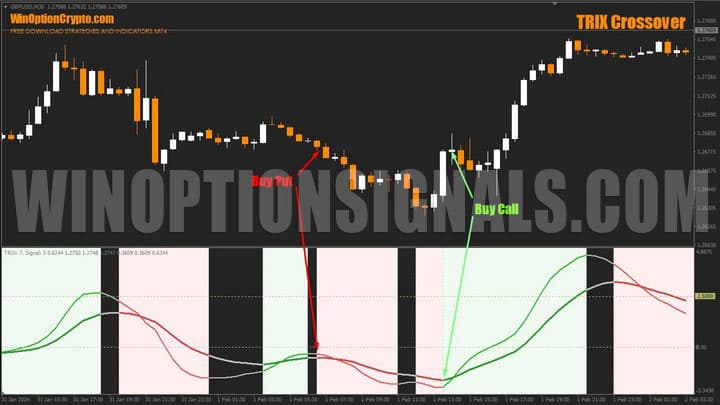
"Trix and Signal Moving in One Direction" Mode
In this mode, both lines move in the same direction, indicating that short-term and long-term trends are aligned. This is precisely the rationale behind this signal type — when trends on different timeframes point the same way, continuation becomes more likely.
Zones where both oscillator lines point in the same direction are colour-coded: light green for Call, pink for Put.
Trading Rules for the TRIX Crossover Indicator
The "Trix and Signal Moving in One Direction" mode identifies the start of new price impulses with reasonable accuracy, and this is what we use as the basis for entry decisions. Forex traders can apply it as a complete trading system: enter when both lines point in the same direction, and exit when they diverge and begin moving in opposite directions.
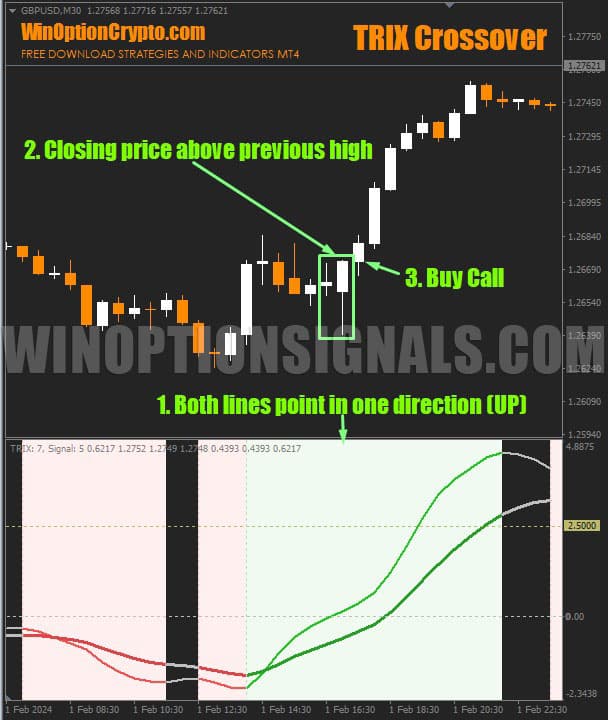
To buy a Call option:
1. Both oscillator lines are green.
2. The closing price of the last candle is higher than the high of the previous one.
3. At the open of the next candle, buy a Call.
To buy a Put option:
1. Both oscillator lines are red.
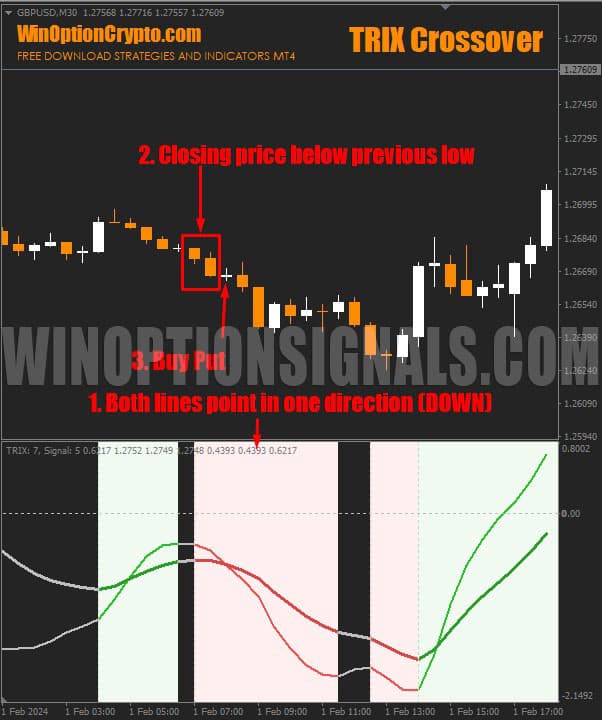
2. The closing price of the last candle is lower than the low of the previous one.
3. At the open of the next candle, buy a Put.
Any timeframe can be used. The recommended expiration is 3 candles.
Opening a Call Option
Both subwindow oscillator lines are pointing upward. Once you confirm that the closing price of the last candle is higher than the high of the previous one, buy a Call at the open of the next candle.
Opening a Put Option
Both oscillator lines are pointing in the same direction (downward). The closing price of the last candle is lower than the low of the previous one. Buy a Put at the open of the next candle.
Conclusion
TRIX Crossover can be used in binary options trading as both a trend indicator and an oscillator. It offers three operating modes, but in our view, only one is genuinely worth using — identifying market zones where the short-term and long-term trend lines point in the same direction. For more precise tracking of price dynamics, the indicator also includes a built-in histogram and auxiliary levels.
In our opinion, the price of this signal oscillator is considerably higher than its practical value warrants, given that only one of its three modes is of real interest.
Before using it in live binary options trading, we recommend testing it thoroughly on a demo account. Only after verifying the effectiveness of its signals and building sufficient practice should you move on to trading with reliable brokers. Always apply the principles of risk management and money management.
Download the TRIX Crossover Indicator

To leave a comment, you must register or log in to your account.