Most traders are familiar with price channels and their role in trading. Building them manually can be challenging, however, since it is not always easy to read the current market situation or anticipate what comes next. This is where the Linear Regression Channel indicator for binary options can help.
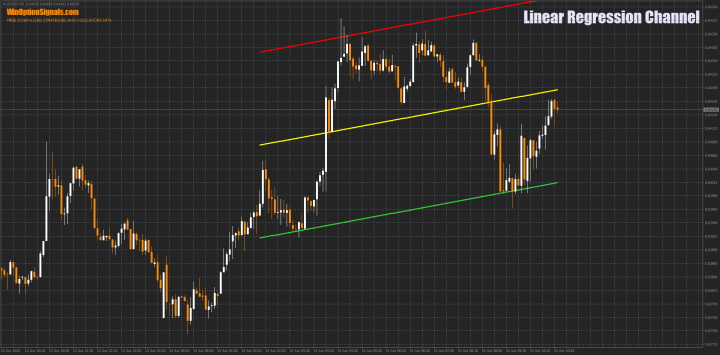
This indicator automatically plots channels on the chart, dividing the range into two equal halves. The result is a support level, a resistance level, and a 50% midline between them.
Description of the Linear Regression Channel Indicator
This indicator is available in many terminals, including a live chart for binary options on our website. The most convenient option, however, is the version for MetaTrader 4.
Instructions for installing indicators in MetaTrader 4:
The indicator is straightforward and requires little explanation. It works entirely through support and resistance lines that form a price corridor:
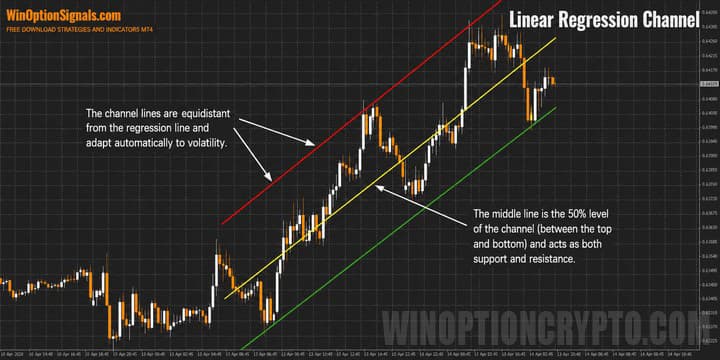
The lines are separated by a standard deviation, which produces well-defined price boundaries. This deviation is fixed at a value of 2 and cannot be adjusted — though as will become clear shortly, this does not present any limitation.
The indicator settings include:
- Calculation of levels based on closing prices.
- Number of bars used to build the channel.
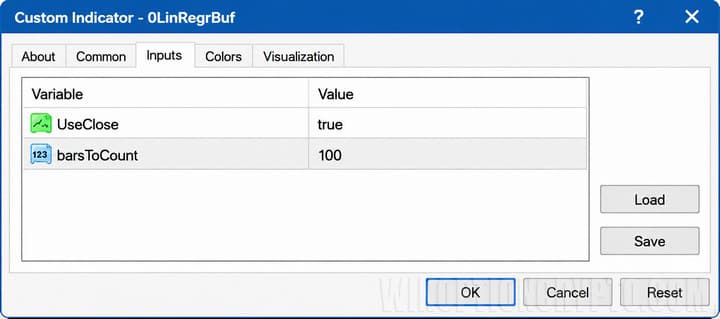
The first setting is self-explanatory. The second allows you to build channels across almost any range:
| Channel length 50 bars | Channel length 100 bars | Channel length 150 bars |
|
|
|
|
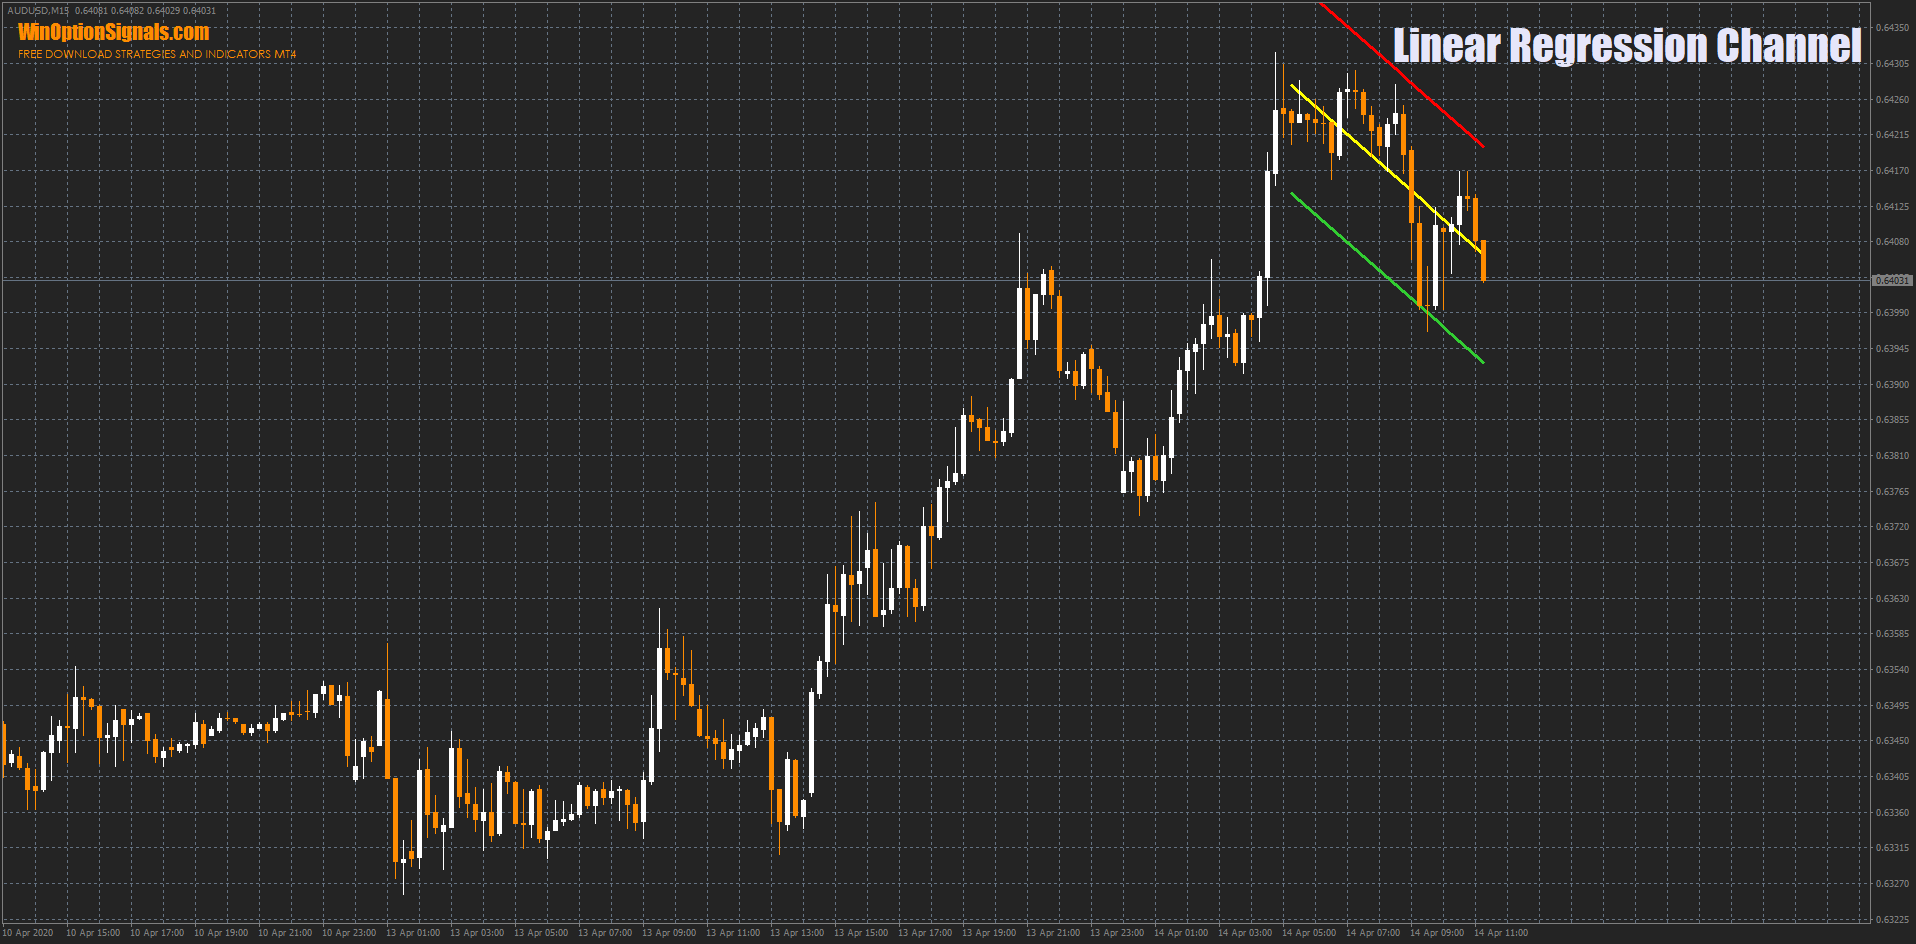
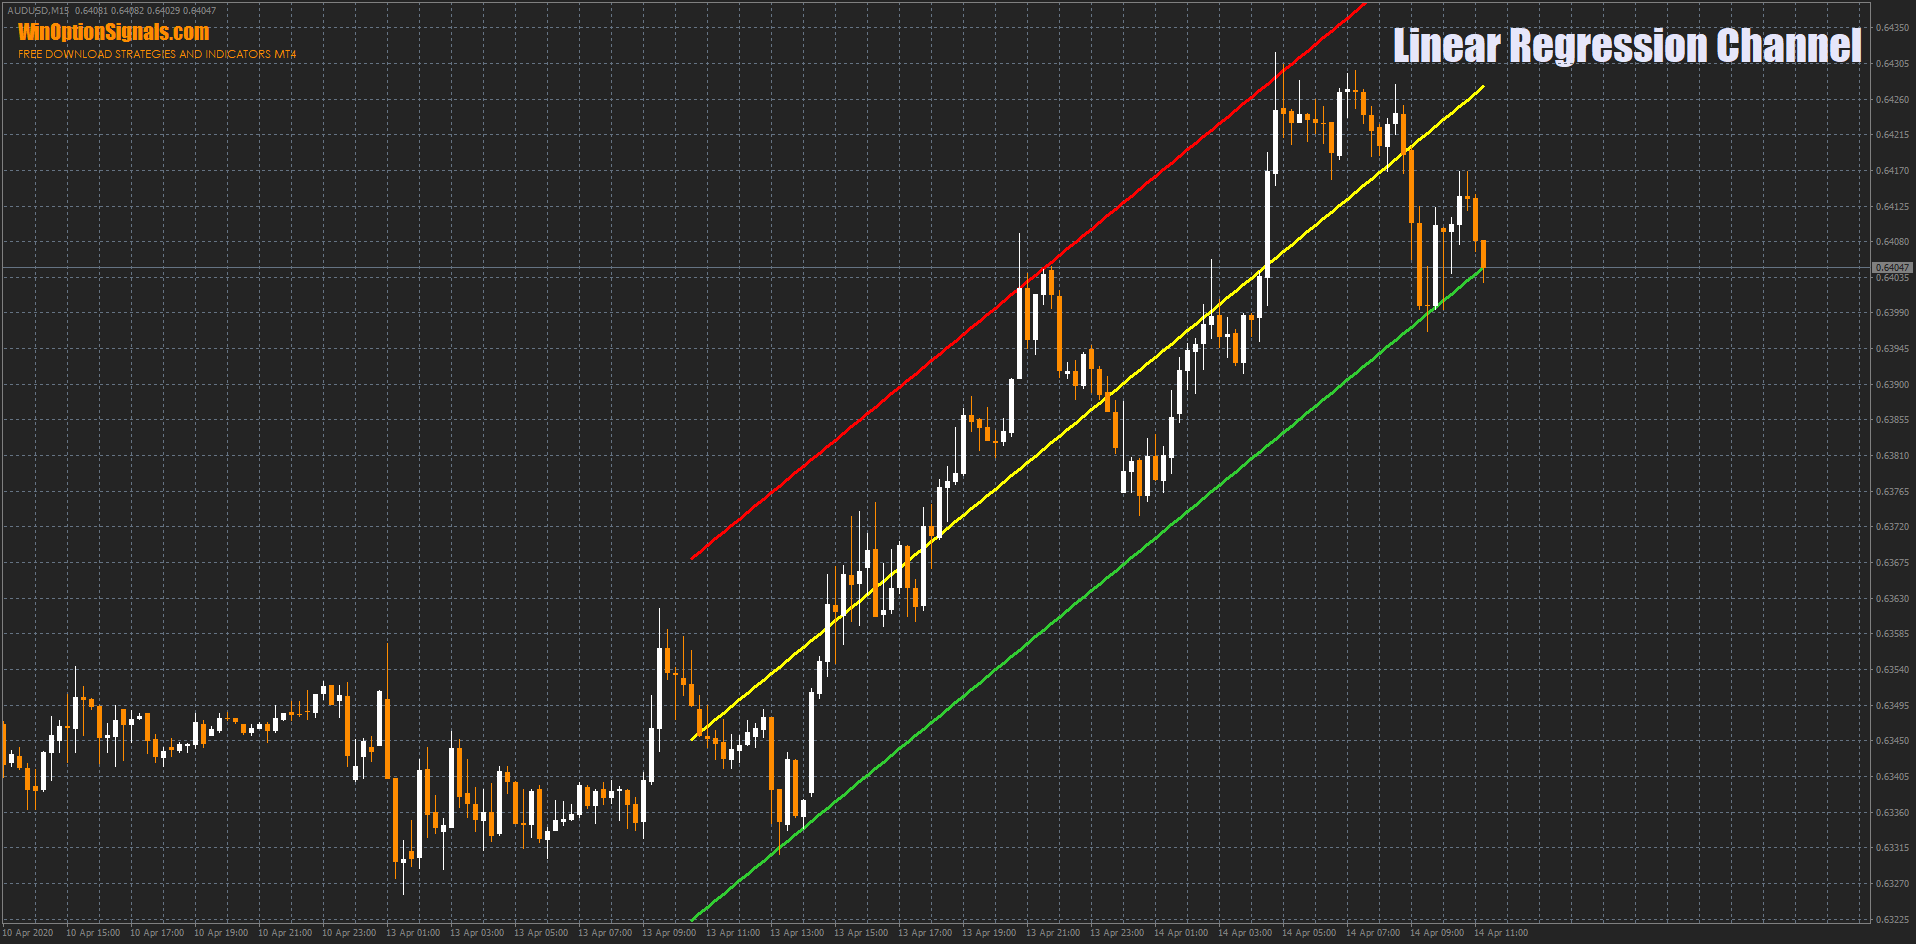
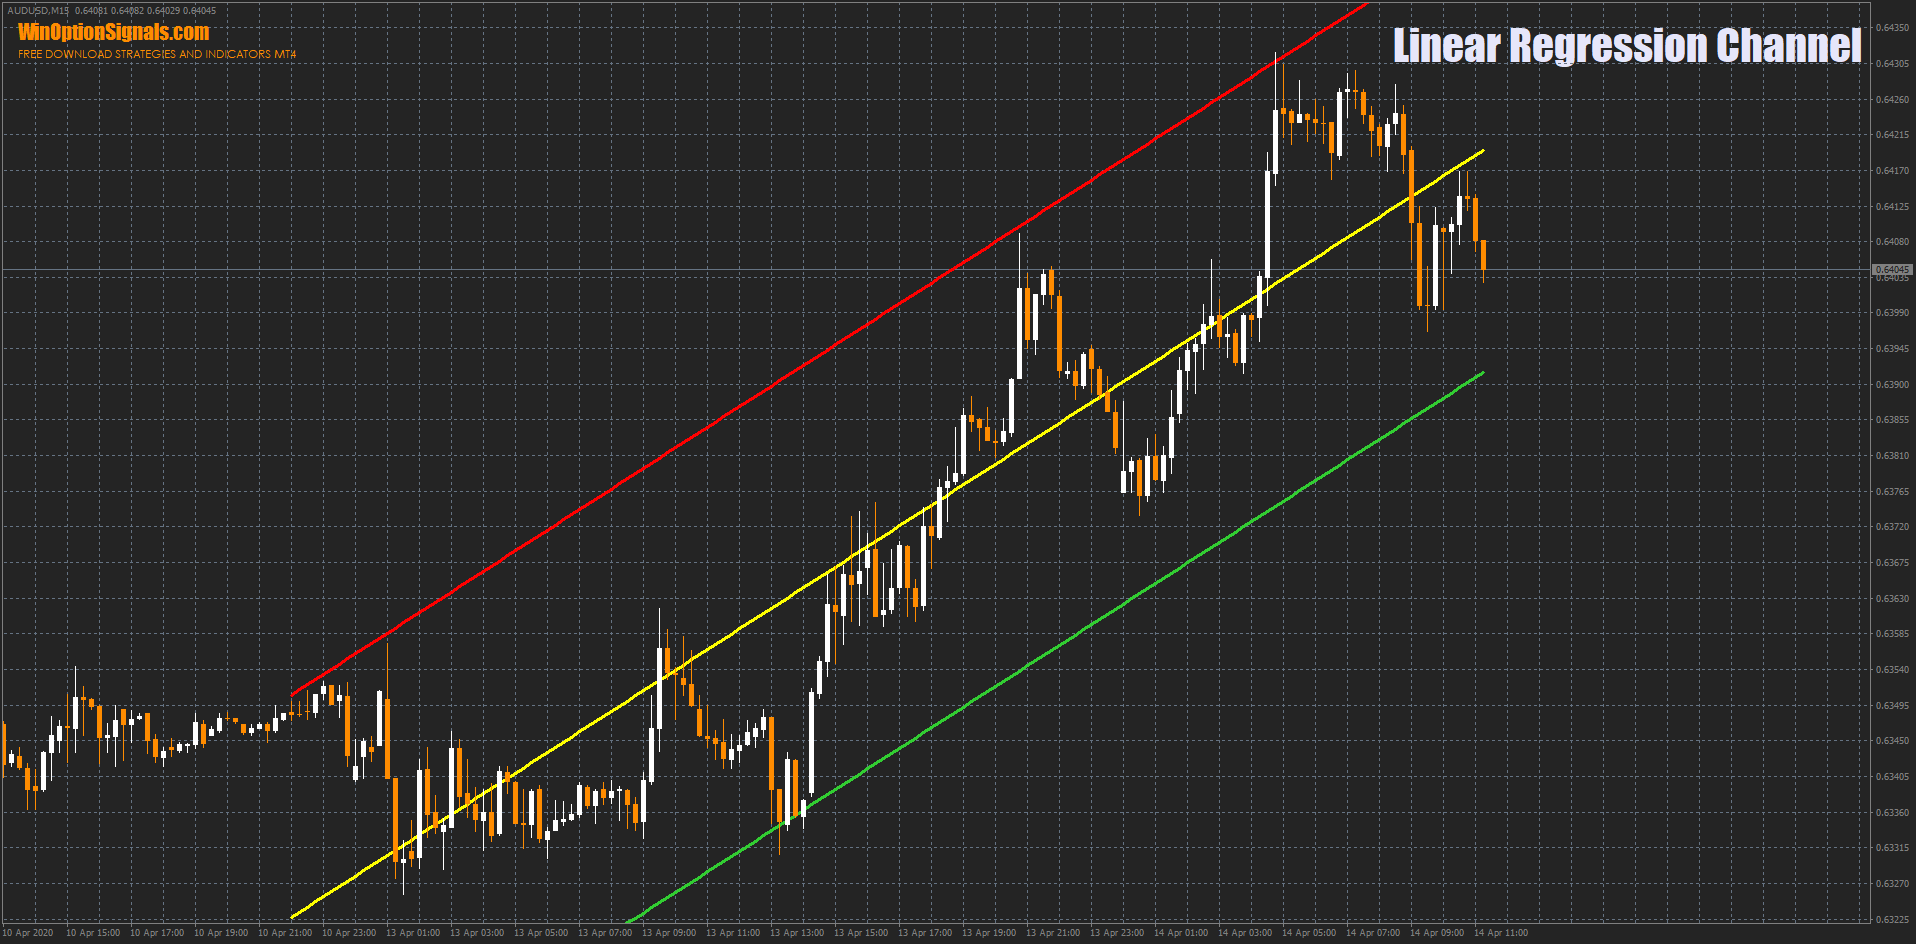
This means that on the same section of the chart you can display price channels of different widths and directions simply by adjusting the "barsToCount" parameter. Varying the bar count eliminates any need to modify the standard deviation value.
Trading with the Linear Regression Channel Indicator
One of the strengths of this indicator is that it grounds a trader's decisions in technical analysis. There are many binary options strategies built around price channels, and they all follow the same straightforward rules. Below are the three most widely used trading methods.
Regarding expiration time, a 1-candle expiration works well for quick trades on shorter timeframes. On timeframes of M30 and above, an expiration of 5–10 candles is more appropriate.
Longer expirations are also more effective when trading with the trend (covered in more detail in the third method below).
Breakout Trading with the Linear Regression Channel Indicator
The most popular way to trade price channels is the breakout method. Its main drawback is that the indicator redraws its levels whenever a new high or low is set. Without this behavior, the levels would remain static, making the indicator ineffective. For this reason, when trading breakouts, you should mark levels as price approaches them, then open a position once the candle closes above or below the level:
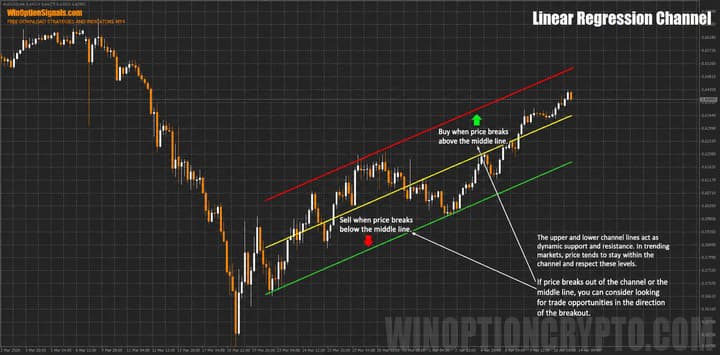
Note that no trade is opened if the candle closes within the range.
The fixed midline level should not be overlooked either:
Trading breakouts of the 50% level is more convenient, since this level does not redraw.
Bounce Trading with the Linear Regression Channel Indicator
The second popular trading method involves bouncing off channel levels.
Here, the price should close within the range as it approaches the level, rather than above it. A particularly strong signal is a candle whose wick breaks through the level but closes back on the other side:
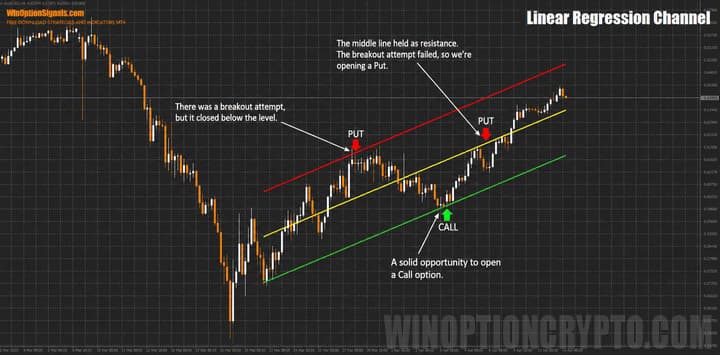
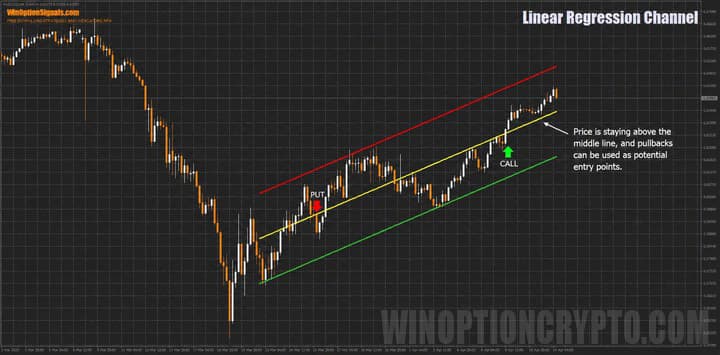
Trend-Following Trading with the Linear Regression Channel Indicator
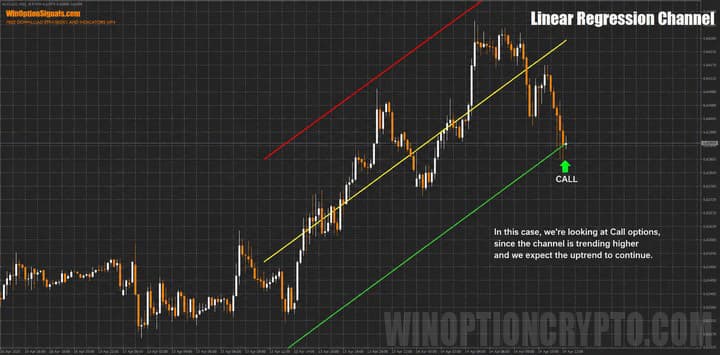
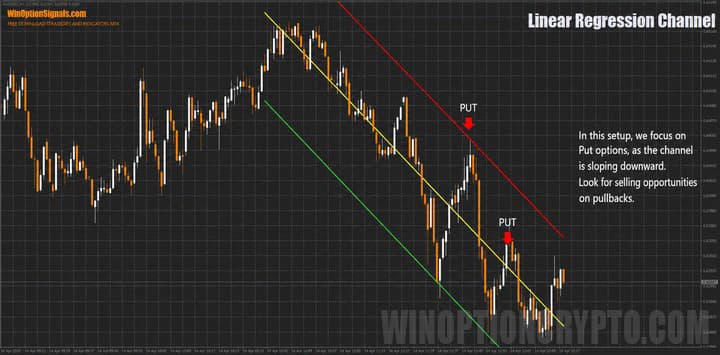
This method differs from the bounce approach in that trades are only opened in the direction of the channel. When the channel points upward, only Call options are considered; when it points downward, only Put options. The same logic applies to the midline.
The channel is directed upward:
The channel is directed downward:
Conclusion
As shown above, the Linear Regression Channel indicator is a versatile tool that supports both trend-following and counter-trend trading, while its settings allow you to define both short-term and long-term channels.
Keep in mind that sound trading always involves applying money management principles and managing your risk, so it is advisable to test all approaches on a demo account before moving to a live one.
Also remember that choosing a reliable broker is one of the foundations of profitable trading — you can find one in our binary options broker ratings.
Download the Linear Regression Channel Template and Indicator
Not sure how a particular strategy or indicator works? Leave a comment below, and subscribe to our YouTube channel WinOptionCrypto — we'll answer your questions in upcoming videos.

To leave a comment, you must register or log in to your account.