The Fibonacci sequence is a mathematical series of numbers that forms the basis of one of the most popular technical analysis tools used in financial trading. It is built into many trading platforms, including Pocket Option, and underpins numerous binary options strategies. The key feature of this indicator is its ability to identify when the current trend is losing momentum — either preparing to reverse or already moving in the opposite direction. In the Pocket Option terminal, Fibonacci lines can be added via the "Constructions" section.
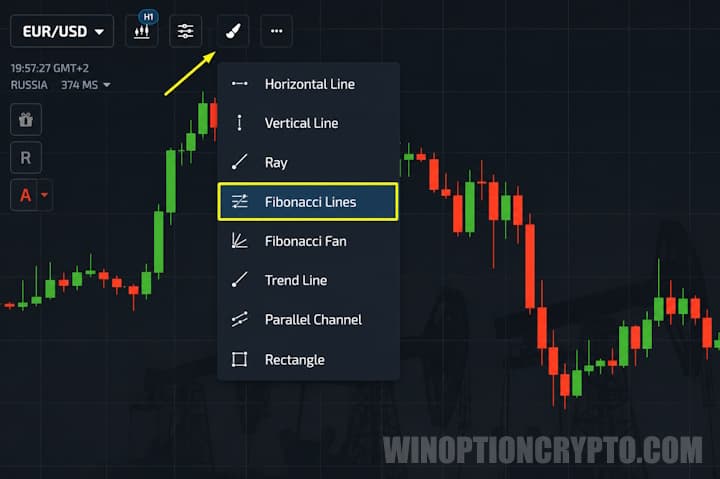
Setting Up the Indicator
The Fibonacci sequence begins: 1, 1, 2, 3, 5, 8, 13, 21, and so on. However, it is not the sequence itself that forms the basis of the indicator, but the "golden ratio" derived from it — 1.618 — with the indicator using its inverse, 0.618.
In the context of binary options trading on Pocket Option, this tool works as follows: the price does not always move in a single direction. There comes a point when the trend loses strength, which is signaled by candles opening in the opposite direction. This is when Fibonacci lines should be applied to the chart.
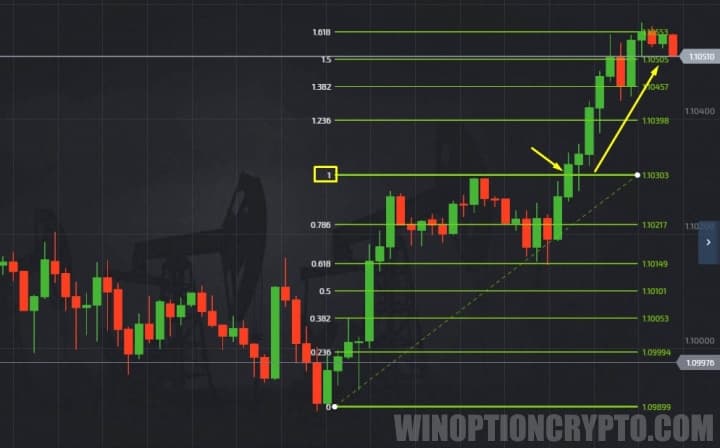
Once the tool is applied, a grid of horizontal levels appears on the chart — 0, 0.236, 0.382, and so on up to 1. White anchor points at the end of each line allow you to reposition the grid to match the current price action.
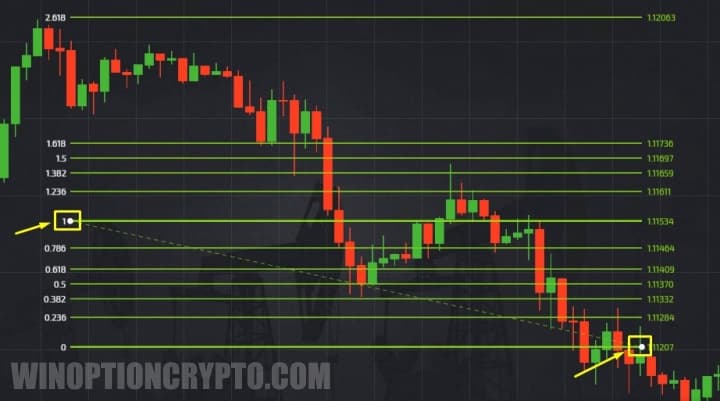
To reposition the grid, hold the left mouse button on each anchor point and drag the lines to the desired level. For correct placement in an uptrend, set level 0 at the point where the reversal begins (the low) and level 1 at the high. In a downtrend, the order is reversed: level 0 at the high and level 1 at the low.
Trading with Fibonacci Lines in Pocket Option
Using Fibonacci lines on Pocket Option is straightforward, as this indicator is particularly effective for pinpointing trend reversal levels. For example, when a trader is buying options in the direction of the current trend, the ideal entry point is when a pullback ends and the trend resumes.
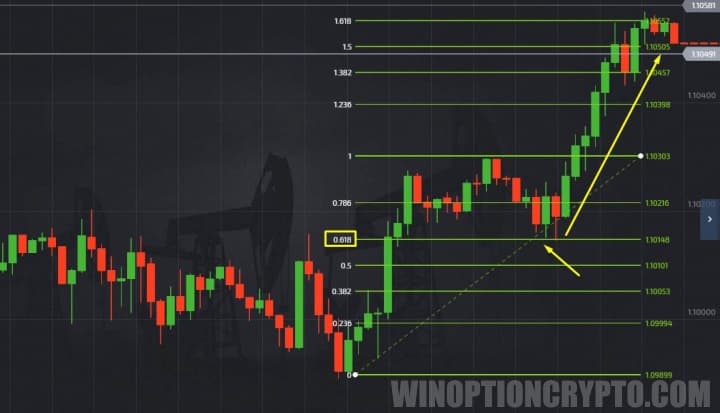
The 0.618 level is central to this approach. If the price bounces off this level and continues moving in the direction of the prevailing trend, it signals that the correction is complete. Based on this condition, you should:
- buy a Put option:
- buy a Call option:
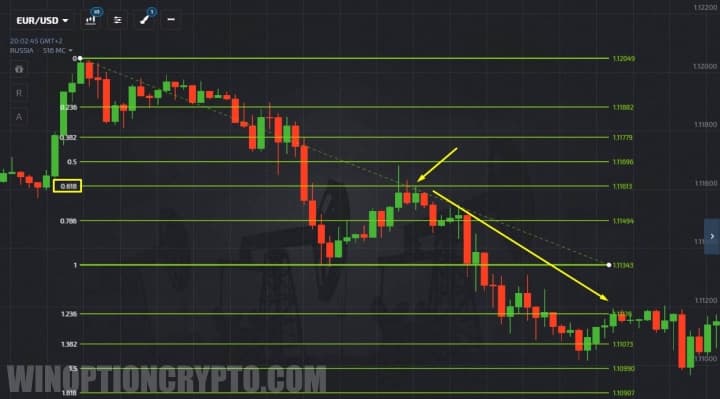
If the price breaks through the 0.618 level and continues in the same direction, this signals a reversal of the current trend. In such conditions, it is advisable to avoid opening any option trades until a new trend has clearly established itself.
Some traders use two levels simultaneously: 0.618 and 1. If the price breaks through both, this signals a strong trend and a potential opportunity to enter option trades.
Fibonacci lines are an accessible technical analysis tool that even novice traders can apply in practice.
Also, keep in mind that you can start trading with additional funds by using promo codes for account top-ups from Pocket Option, and to improve your results with this strategy, you can use a promo code to cancel loss trade $10.
OPEN AN ACCOUNT WITH POCKET OPTION
Not sure how this strategy or indicator works? Leave a comment below, and subscribe to our YouTube channel WinOptionCrypto — we'll answer your questions in an upcoming video.

To leave a comment, you must register or log in to your account.