Among the available trading approaches on Pocket Option, technical analysis is more popular with beginners than fundamental analysis. This comes down to the nature of each approach. Trading binary options on Pocket Option using fundamental analysis requires constantly monitoring financial news and economic indicators. Working with technical tools is simpler and more accessible — and most of them are built into the Pocket Option terminal by default.

About Trends and the Rules for Drawing Technical Lines
To understand what a trend is, keep in mind that the price of every financial asset is in constant motion. On a chart, this appears as candles opening in one direction or another, depending on the balance of supply and demand. There are three types of trends, or three directions of price movement:
- upward, in which demand exceeds supply;
- downward, when selling pressure exceeds buying demand;
- sideways (flat), in which supply and demand are roughly in balance.
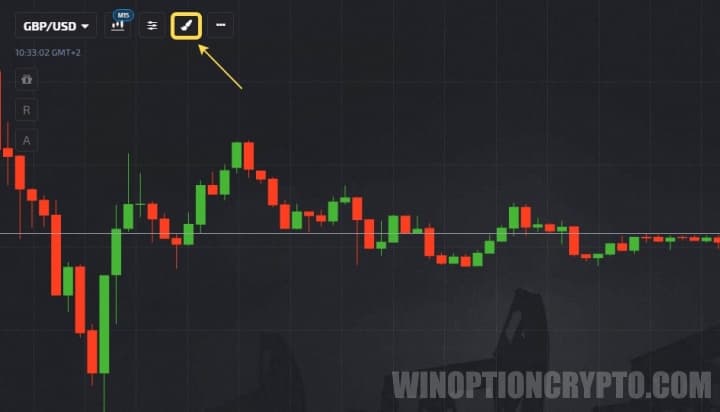
The technical line tools built into the Pocket Option terminal help identify the direction of the current trend. They can be found in the "Constructions" section.
On the chart, a trend is defined by two lines: support and resistance. They are drawn according to the following rules:
- The support line sits below the price chart. To draw it, identify two lows and connect them with a straight line. This line slopes upward, so the second low must be higher than the first.
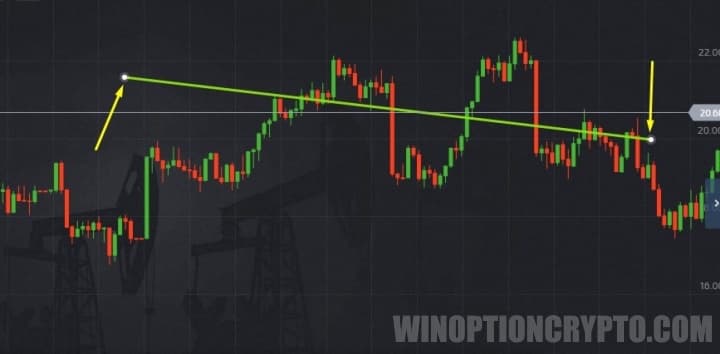
- The resistance line sits above the price chart. To draw it, identify two highs and connect them with a straight line. This line slopes downward, so the second high must be lower than the first.
To place these lines, go to the "Constructions" section in the Pocket Option terminal, select "Trend lines," and drag each line to align with the corresponding price points on the chart.
How to Trade Binary Options Using Technical Lines on Pocket Option
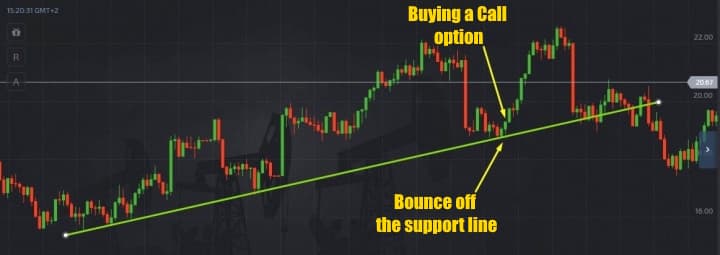
Before trading on Pocket Option with trend lines, note that in an uptrend the key reference line is support, while in a downtrend it is resistance.
Within this strategy, open a Call option when the price bounces off the support line and continues moving upward.
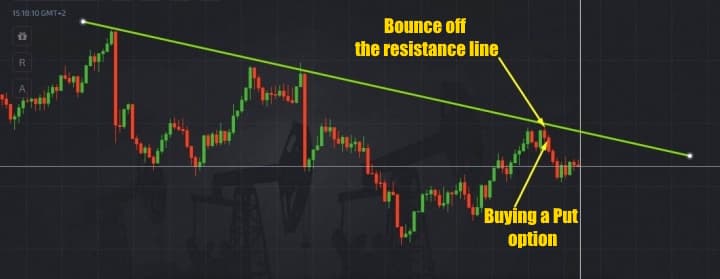
Put options are opened in the opposite situation: during a downtrend, when the price bounces off the resistance line and continues moving downward.
For the examples shown, the expiration period should equal the formation time of two candles. This strategy can be applied on any timeframe and is suitable for all trading styles, including long-term trading.
Also, remember that you can start trading with additional funds by using promo codes for account top-ups from Pocket Option, and boost your results with this strategy by using a promo code to cancel loss trade $10.
OPEN AN ACCOUNT WITH POCKET OPTION
Can't figure out how this strategy or indicator works? Leave a comment below and subscribe to our YouTube channel WinOptionCrypto — we answer all your questions in our videos.

To leave a comment, you must register or log in to your account.