A currency heat map is a table that aggregates statistics on the movement of currency pairs over a given period, with the core trading idea being either to follow the trend or to trade against it. But does a currency heat map actually work as a binary options strategy?
How Currency Heat Map Trading Works — and Why It Falls Short
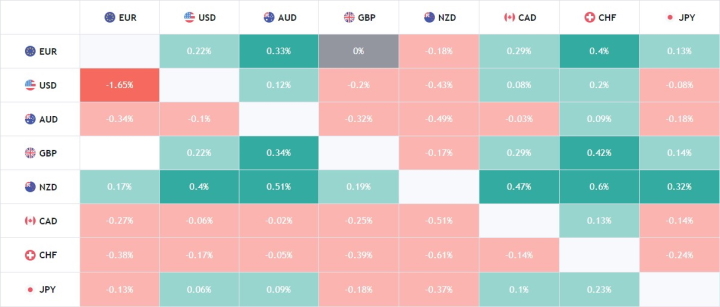
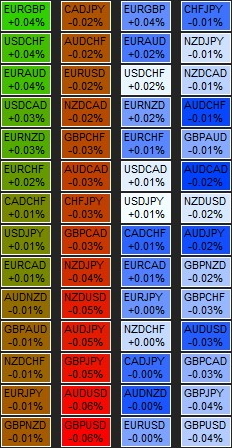
Despite the number of articles promoting heat map strategies for binary options, this approach is difficult to recommend as genuinely effective. The reason is simple: all a heat map shows is the relationship between the current candle and the previous one on a given timeframe. A green cell in the currency pair grid means the current candle is higher than the previous one; a red cell means it is lower:
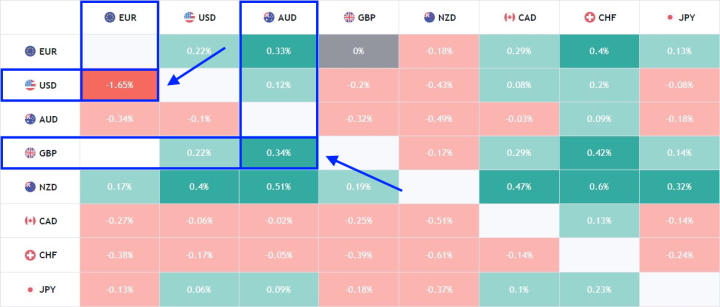
The trading rules commonly described in these articles suggest that a bright green cell is a signal to sell the currency (Put option), and that when a cell turns bright red, you should buy (Call option). In other words, the approach involves trading against the current candle's direction.
This creates an inherent problem: you are essentially trading against the trend — particularly problematic when using 30-minute or higher timeframe heat maps for signals. Consider what happens when price is in a sustained move like this:
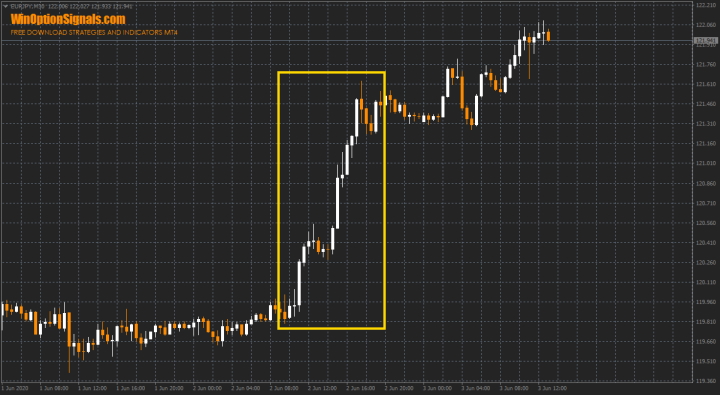
During a sustained uptrend, the heat map will show consistent green — and trading in the opposite direction on each candle will result in repeated losses.
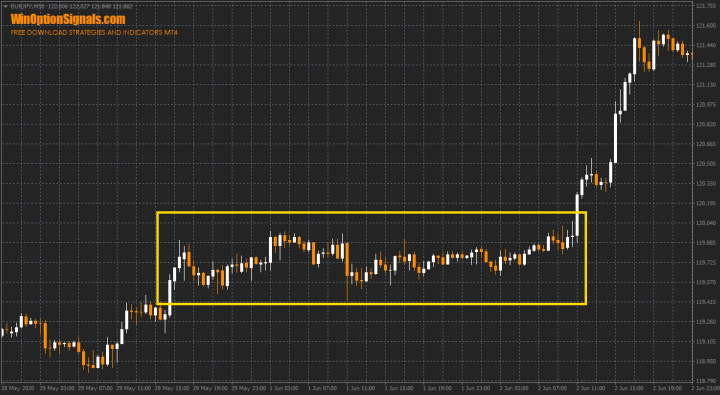
Trading with the candle's direction rather than against it is no guaranteed solution either. In a flat market, the heat map colours will alternate unpredictably, producing a similarly poor outcome:
The conclusion is that using a currency heat map for binary options only makes sense when combined with a proper understanding of what a trend is and how to identify one. For longer-term trading goals, the heat map alone is not a viable tool.
What a Currency Heat Map Is Actually Useful For
Where a currency heat map does add value is as a general informational overview of current market conditions. The higher the timeframe, the more meaningful the picture it provides.
Most online heat map services use fixed time intervals, which limits flexibility. A purpose-built heat map indicator solves this by displaying not only colour coding but also the percentage change for each currency pair:
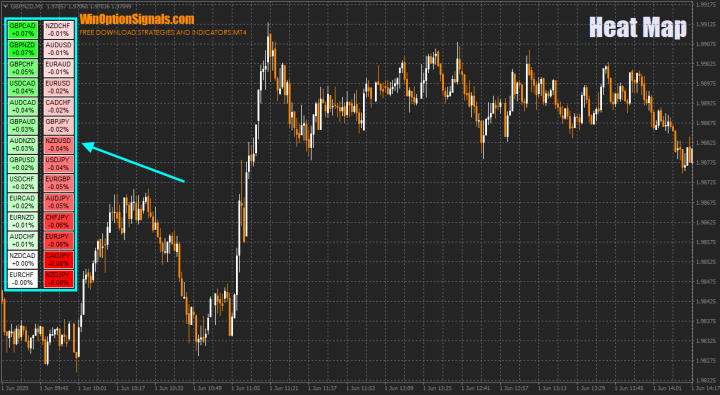
A key advantage of this indicator is that it reads the currency pairs directly from your MT4 terminal, eliminating the quote discrepancies that can occur when using external heat map services.
The indicator also supports alternative colour schemes:
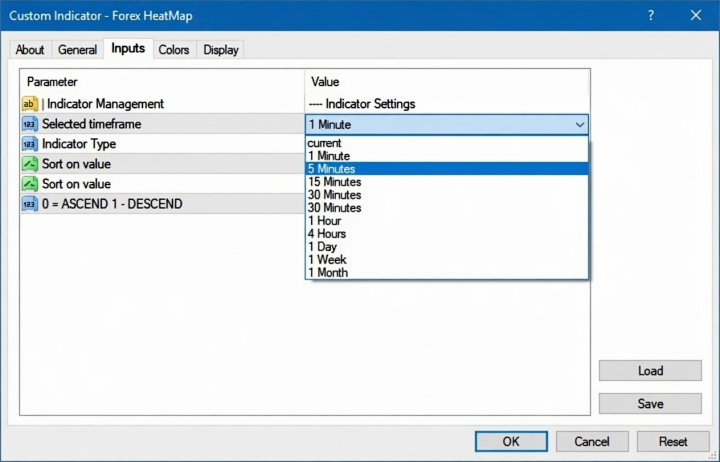
And it allows any timeframe to be set for the map — including the 1-minute chart:
These features make it considerably more flexible than the fixed-interval alternatives available online.
Installing the Currency Heat Map Indicator in MT4
The indicator is a single file and is installed in the standard way in MetaTrader 4. For a step-by-step guide, see the video below:
Conclusion
A currency heat map is not a reliable standalone trading tool for binary options — but it can serve as a useful market overview indicator when used for informational purposes alongside a proper trading system.
Profitable trading also depends on choosing a reliable broker. If you have not found one yet, our binary options broker rating is a good place to start.
Download the Heat Map Indicator
Have questions about how this strategy or indicator works? Leave a comment below, and subscribe to our YouTube channel WinOptionCrypto — we'll answer your questions in upcoming videos.
To leave a comment, you must register or log in to your account.