The standard RSI indicator features in many trading strategies, and its effectiveness is well established. It has been subject to various modifications over the years, with traders independently optimizing it to improve signal accuracy for binary options.
The authors of the guide "New Technical Trader" — seasoned investors with many years of experience — also set out to improve the RSI by addressing what they saw as a significant drawback. Tushar Chande and Stanley Kroll took issue with the fact that the indicator's readings could remain within the 20–80 channel for extended periods without crossing its conventional boundaries.
Their new development, the Stochastic RSI, is more sensitive and more frequently shows prices entering oversold or overbought territory.
Key Features of the Stochastic RSI Indicator
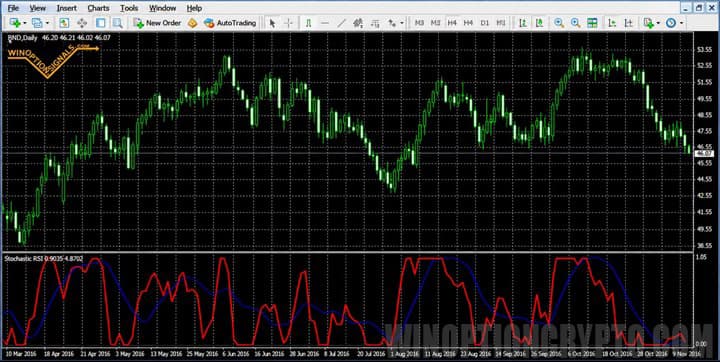
This indicator is installed on the MetaTrader 4 platform. It can be used on any currency pair and any timeframe, with no restrictions on the time of day.
Downloading and installing the indicator is straightforward — simply follow the standard installation instructions.
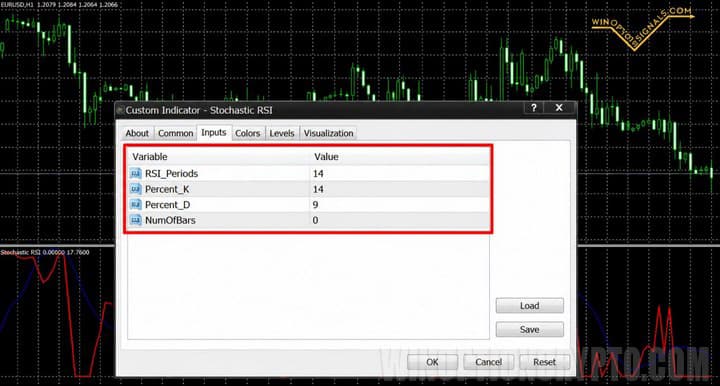
The indicator has just four settings:
- NumOfBars — the number of bars taken from history for calculations;
- RSI_Periods — the RSI period;
- Percent_K — the %K stochastic parameter;
- Percent_D — the %D stochastic parameter.
The standard Stochastic oscillator includes a "slow down" setting that helps filter out excess noise. In this hybrid version, that setting has been removed as unnecessary.
The Stochastic RSI is a stochastic oscillator built on RSI values rather than price itself.
When analyzing data, the RSI compares the absolute magnitude of price declines against price gains over a specified period. The result is plotted as a curve with values ranging from 0 to 100. The standard Stochastic, by contrast, compares the closing price of a candle to the high and low over a given period. The Stochastic RSI combines both approaches: it generates signals based on a comparison of the current RSI value against previous RSI values within a defined window of the chart.
The result is an indicator that is more flexible and responsive to market changes, reflecting price movements in a timely manner.
Instructions for installing indicators in MetaTrader 4:
Using the Stochastic RSI Indicator
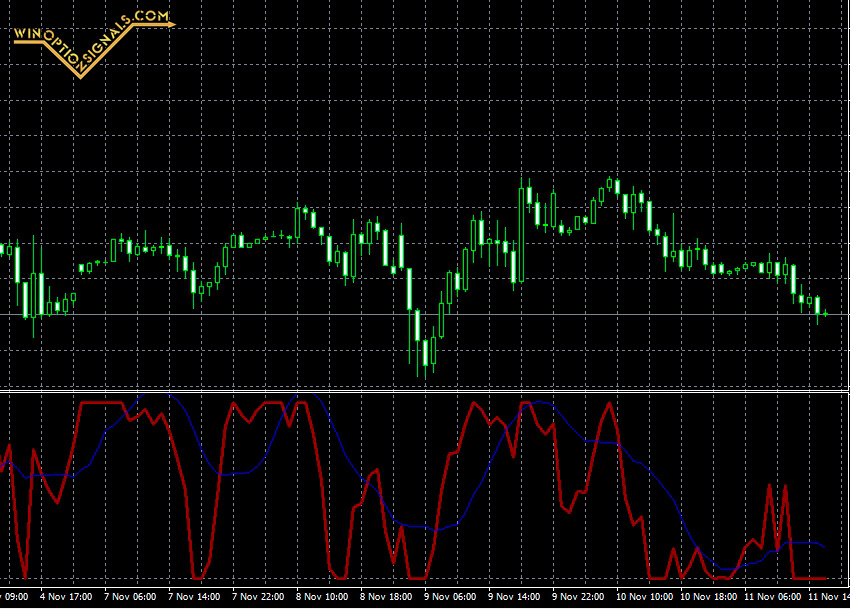
As a combination of two oscillators, the Stochastic RSI is itself an oscillator. It resembles a standard Stochastic but without the traditional overbought and oversold zones, which are replaced by the levels 0 and 100.
When the RSI reaches a new low, the indicator reads zero. When the RSI reaches a new high, the Stochastic RSI rises to 100.
Trading recommendations:
- Focus on overbought and oversold conditions by adding the standard Stochastic levels of 20 and 80. When the indicator crosses these levels, it signals a potential entry. Bear in mind, however, that the higher sensitivity of this oscillator also produces more false signals;
- The level 50 serves as an excellent filter. When the indicator crosses this level, it may be time to open a trade — this type of signal tends to be both reliable and timely. When the indicator is above 50, favor buying; when it is below 50, favor selling;
- Crossovers of the signal and main lines are also worth watching, particularly when they occur within overbought or oversold territory, as they can indicate an impending price reversal.
Approaches that do not work well with Stochastic RSI:
- Trading based on divergences;
- Reversal patterns, trend lines, and similar methods.
The Stochastic RSI oscillator is useful for both beginners and experienced traders. It is quite effective at identifying RSI extremes, but as with any indicator, it should be used in combination with other tools for more reliable filtering of false signals.
Download the Stochastic RSI Indicator
Not sure how a particular strategy or indicator works? Leave a comment below, and subscribe to our YouTube channel WinOptionCrypto — we'll answer your questions in upcoming videos.

To leave a comment, you must register or log in to your account.